Correlate qualitative and quantitative metrics
DX helps engineering organizations combine qualitative and quantitative metrics under one platform, giving them a full picture of developer productivity. But bringing together qual and quant isn’t just about the convenience of having a single view – unifying data opens the door to new insights and opportunities.
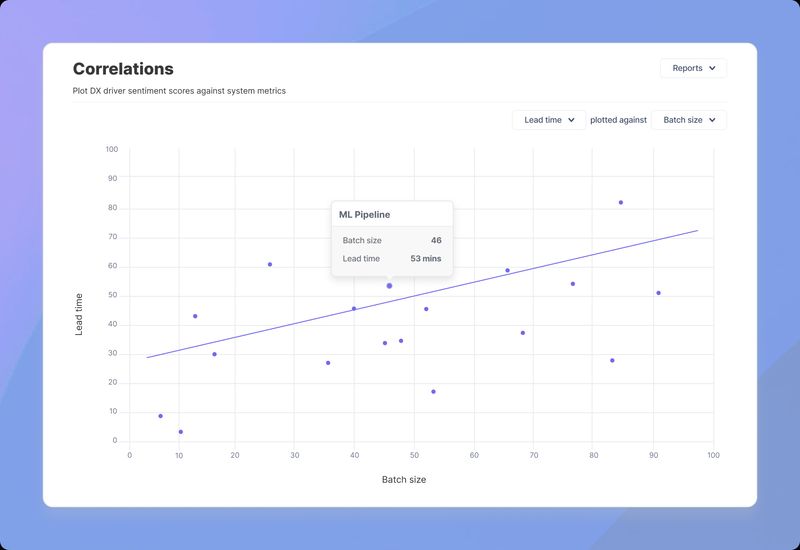
Today, we’re rolling out a new product feature: the ability to correlate qualitative metrics in DX against hard metrics like lead time and build performance, to help you make data-informed decisions on where (or where not to) invest. DX lets you plot metrics on a scatter plot to quickly uncover relationships in your data visually, without cumbersome statistical analysis.

For example, many organizations aim to increase their performance in DORA metrics but have difficulty identifying where to invest in order to improve. By correlating specific areas of the developer experience with DORA metrics, DX can show you exactly where to focus – for example, reducing batch size as shown in the chart above.
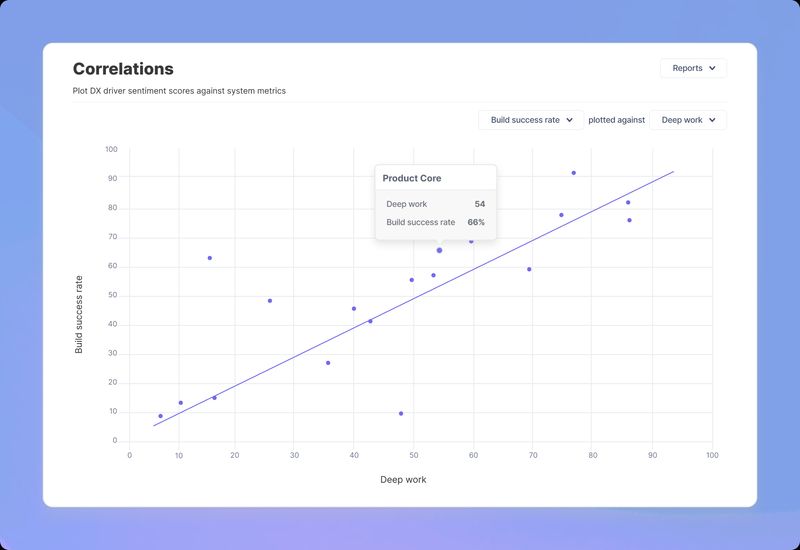
Another common question that DevEx leaders have: how does build pipeline performance affect productivity? One of our customers used DX to answer this, and discovered that build success rates correlated with developers’ ability to do deep work (an example of what their data looked like is shown below). This data gave them powerful ammunition to help convince stakeholders that improvements to their CI/CD pipelines could drive high ROI.

These are just a couple examples of how correlations between qualitative and quantitative metrics can help inform decision-making and strategy. Of course, close examination of quantitative metrics should be preceded by an analysis of your key drivers against organizational goals using IPMA.
For more examples of how leading tech companies are combining qualitative and quantitative metrics, download our recent industry report. To learn more about how DX provides insights to help you understand and improve developer productivity, please request a demo.
