Announcing the general availability of Data Cloud

Qualitative and quantitative metrics are complementary approaches to measuring developer productivity. Qualitative data gives us a holistic view of what’s slowing down developers, while quantitative metrics like DORA provide an objective picture of work that is happening.
Today, we are announcing the general availability of Data Cloud, our new engineering data and analytics offering. With Data Cloud and DevEx 360 combined under a single platform, DX offers the only solution on the market that unifies qualitative and quantitative insights to provide a complete view of developer productivity.
Why did we build Data Cloud? The answer: despite there being a number of existing engineering analytics solutions already on the market, we learned through our customers that none were effectively meeting the needs of larger organizations.
Leaders we spoke to frequently shared that they felt “trapped” by their existing solutions due to the inability to customize metrics or access their raw data. Many of these organizations had resorted to building their own metrics solutions to fill these gaps, leading to duplicated investments.
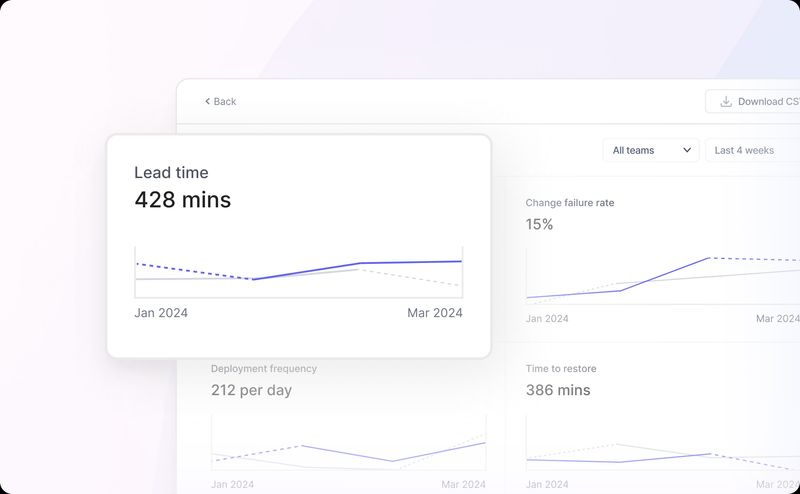
Data Cloud helps organizations avoid these traps with a flexible platform that can scale and adapt to your needs. Data Cloud comes with “instant on” data connectors and pre-built reports for common use cases like DORA metrics, code reviews, and cycle times. Unlike other solutions on the market, however, DX lets you go far beyond out-of-the-box metrics and reports.
DX allows teams across your organization create custom metrics, reports, and dashboards using SQL to access raw data within DX. Jarryd Trokis, Engineering Manager at Monzo Bank, shares: “Before DX, we tried a number of different vendors that offered prebuilt metrics and charts. But the way these platforms worked didn’t align with how we wanted to present our metrics. We love how Data Cloud seamlessly integrates into our workflows and gives us flexibility to create custom reports and access our raw data.”
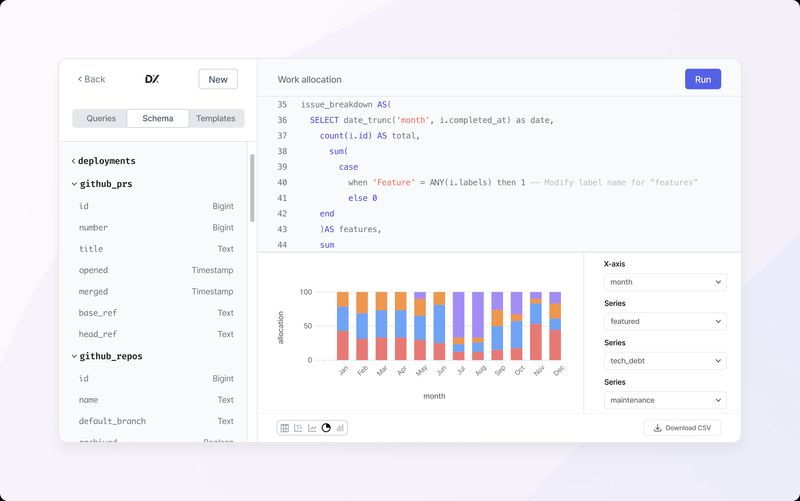
To streamline custom report creation, DX provides a built-in template library that includes reports for investment allocation and R&D cost capitalization. Lindsey Simons, VP of Engineering at Vercel, shares: “We’ve been able to automate reporting on work allocation and R&D cost capitalization, eliminating substantial manual effort for our finance and accounting teams.”
DX is now the only solution on the market that combines qualitative and quantitative insights to provide a complete picture of developer productivity. Bringing data together into one place helps streamlines data reporting, enable data correlations, and – most importantly – ensure a healthy culture around data and metrics.
Mark Campbell, Engineering Manager at Chime, shares: "We explored other developer metric tools but were concerned about how they might foster a divisive culture due to their narrow focus. With Data Cloud, we have been able to combine quantitative metrics with our qualitative data from DX to get a holistic view into developers’ challenges. Data Cloud serves as our developer metric data warehouse, sparking meaningful improvement discussions and greatly enhancing our velocity and positive culture.”
Data Cloud is available for standalone purchase or as part of the full DX product suite. To learn more about Data Cloud and other DX products, request a demo today.