New in DX: Cohort analysis
A new report that lets you compare engineering metrics side-by-side across developer cohorts.

Kali Watkins
Product Marketing
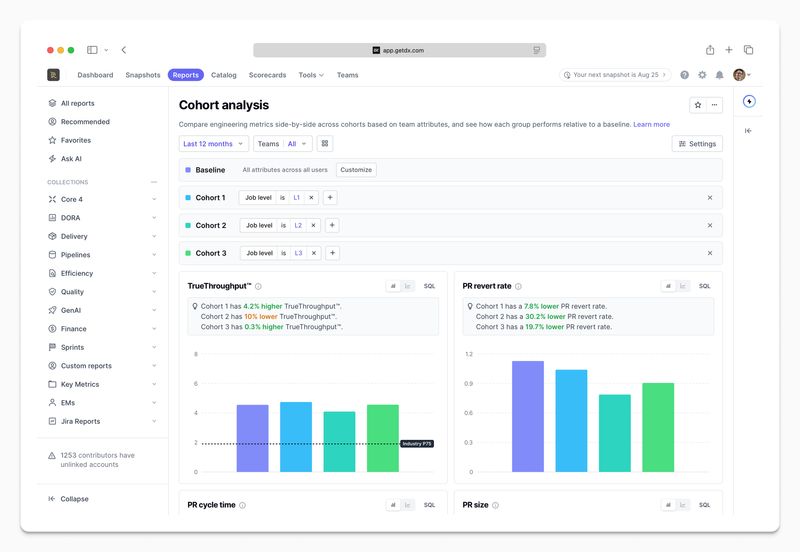
This week, we launched cohort analysis in DX, a new report that lets you compare engineering metrics side-by-side across developer cohorts. For example, you could evaluate the impact of a new deployment pipeline by checking whether the pilot group has a shorter cycle time than the rest of the organization.
How the report works
Cohort analysis lets you define up to three cohorts based on attributes. (Attributes are tags you can assign across any category, like team, role, location, AI tool usage, or tenure band.) Each cohort is compared against a baseline, which defaults to “all users” but can be customized to any attribute set.
Cohorts support both inclusion and exclusion rules, so you can get as targeted as you need—for example, “Job level is L1 and location does not = Remote.”
Once configured, you’ll see each metric displayed as a tile in a side-by-side grid across all cohorts, with industry benchmarks available as an overlay.
Why we built it
The AI impact report gave teams a way to compare developer cohorts through the lens of AI adoption. Customers loved the format and asked for the same cross-sectional view beyond AI—across job levels, experience bands, tooling, and more. Cohort analysis gives the same experience that works across any attributes your organization tracks.
Getting started
Cohort analysis is available now alongside your other reports in DX. To get started, open the report, set your baseline, and add cohorts using any attributes you’ve already configured.
To learn more, contact your DX account rep or read our docs.