How LinkedIn measures developer productivity

Brook Perry
Marketing
LinkedIn’s engineering organization has always recognized the need to balance investments in product development with those in developer tooling and productivity. To inform their investments—and measure the impact of their efforts—they have continually evolved the way they measure and capture data on developer productivity.
LinkedIn’s approach to measuring developer productivity is led by their Developer Insights team that is part of a broader Developer Productivity and Happiness organization whose mission is to make developers at LinkedIn happier and more productive as defined below:
To measure productivity and happiness, LinkedIn’s Developer Insights team utilized Google’s goals, signals, metrics framework, which surfaced a number of initial qualitative and quantitative measures that the team decided to focus on. The goals of measurement are to help engineering leaders make better informed decisions about how to improve productivity, as well as measure the impact of their efforts.
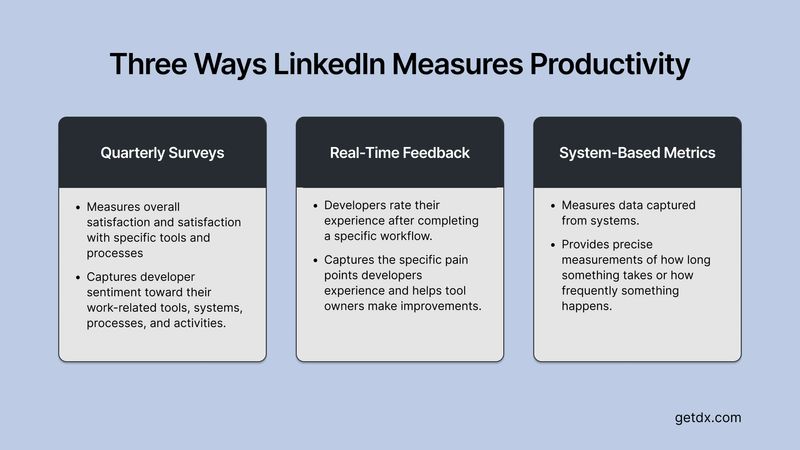
In order to get a comprehensive view of productivity, LinkedIn generates metrics through three different channels: a quarterly survey, real-time feedback, and data from systems. The following sections cover each of these channels in further detail.
Developer productivity survey
The Developer Insights team conducts a quarterly survey that measures developer experience across a wide range of tools, processes, and activities. This survey includes an overall question about developer satisfaction, then asks additional questions about satisfaction with the tools and processes developers use. It uses a combination of standardized scoring (evaluating on a five-point scale) and free-form text responses. In total, a developer taking the survey will respond to around 30 questions within 10 minutes.
The survey is delivered through a proprietary platform that the Developer Insights team develops and maintains. The platform integrates with real-time feedback and data systems, described later, which allows for advanced customization and personalization of the quarterly surveys. For example, they identify which developers use each tool from their real-time feedback system so that the quarterly survey only asks developers about tools they actively use. Additionally, they send targeted survey questions based on information detected from systems, such as build times suddenly increasing.
Real-time feedback
Although quarterly surveys help capture overall sentiment toward developer tools, there is a gap in terms of capturing what is happening in between surveys. To address this gap, the Developer Insights team built a real-time feedback system that captures feedback from developers while they are interacting with specific development tools.
LinkedIn’s real-time feedback system tracks events and actions that developers perform in the various tools they use. Then, the Developer Insights team can decide if, when, and how to solicit feedback from developers based on their activity. For example, when a developer pushes a change through CI and into GitHub, they are asked to rate their experience as well as provide free-form feedback. The feedback system has built-in smart throttling to ensure that developers do not receive too many feedback requests.
By leveraging real-time feedback from their developers, LinkedIn is able to construct a deep understanding of developers’ experiences as they work across various internal tools. Instrumentation across its tools also allows improved segmentation of developers, providing more actionable insights on how to best support developers.
System data
In addition to collecting periodic and real-time survey data, LinkedIn also calculates metrics using data from their systems. These metrics provide high precision (i.e. down to the second), which is important when measuring the efficacy of automated development systems like those listed below:
- Developer Build Time (P50 and P90) - measures the time, in seconds, developers spend waiting for their builds to finish locally during development.
- Post-Commit CI Speed (P50 and P90) - measures how long it takes, in minutes, for each commit to get through the continuous integration (CI) pipeline.
- Deployment Success Rate - measures how often deployments succeed.
The Developer Insights team maintains a global system for ingesting and analyzing system data, which enables teams across LinkedIn to easily create custom dashboards and metrics that are suited to their needs. The data needed to compute their metrics comes from various sources, including MySQL databases, Kafka topics and Hadoop (HDFS), with HDFS being the source data staging area. Pyspark was chosen for data processing and metrics computation. To allow teams to onboard their own metrics, the team introduced a data standardization step that mapped a raw metric dataset into a standardized dataset.
LinkedIn’s approach to capturing developer productivity metrics should provide some direction for others building out their measurement program.