5 metrics in DX for measuring the impact of AI on developer productivity

Kali Watkins
Product Marketing
Most companies start by measuring the adoption of AI coding tools—how many developers use AI tools, and how often. The next phase is to measure impact: is AI making your team more productive, improving code quality, and delivering business value?
DX works with hundreds of organizations to measure the impact of AI. This post shares some of the AI metrics we’re seeing DX customers find most value in today.
5 helpful AI metrics in DX
Measuring developer productivity and understanding how AI influences it requires a multi-dimensional approach. As outlined in the AI Measurement Framework, leaders should evaluate metrics across four key dimensions: speed, effectiveness, quality, and impact.
This article highlights a selection of example metrics that many of our customers have found valuable, but it’s not an exhaustive list. For a complete set of recommended metrics, refer to the AI Measurement Framework. If you’re a DX customer, you can also explore how to capture these metrics directly within DX here.
This article covers:
- TrueThroughput and PR Cycle Time for understanding how AI is influencing delivery speed.
- PR Revert Rate for assessing how AI is affecting code quality.
- The DXI for measuring AI’s impact on developer effectiveness.
- Percentage of Time Spent on Feature Development for understanding how AI is influencing software delivery outcomes.
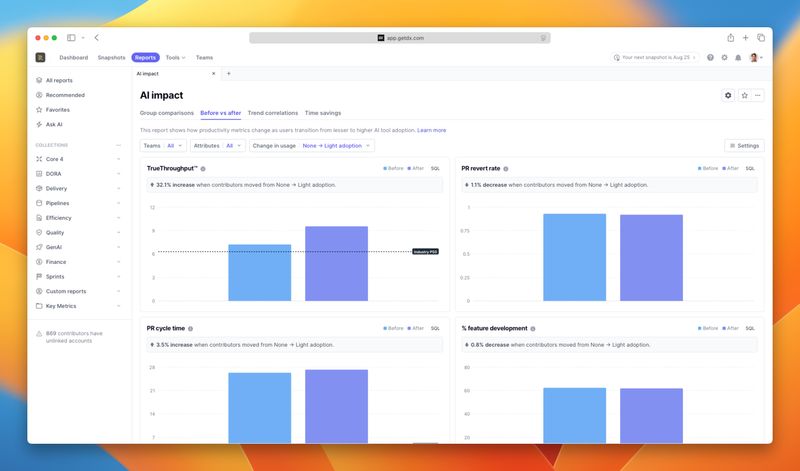
If you’re a DX customer, you can use group comparisons, vendor comparisons, and before-and-after views within the AI Impact reports to visualize how AI usage impacts these metrics.
TrueThroughput
TrueThroughput is a metric in DX that uses AI to take into account the complexity of pull requests to calculate overall throughput. This metric provides a more accurate signal of engineering output than traditional PR Throughput metrics. Leaders can use it to compare AI users versus non-users to understand whether AI is affecting software delivery.
As teams progress from no AI use, to occasional use, and eventually to heavy use, TrueThroughput may rise—reflecting increased output. However, it’s important to view this metric in context. Pair it with quality and effectiveness measures (such as PR Revert Rate or DXI, explained later) to ensure gains in output aren’t offset by declines elsewhere.
Pull Request Cycle Time
Similar to TrueThroughput, PR Cycle Time is another metric for speed. Comparing AI usage against PR cycle time helps provide another signal into whether AI tools are accelerating or slowing teams down.
PR Revert Rate
PR Revert Rate is a metric we often see customers use to assess the impact of AI use on quality. This metric is the number of reverted pull requests divided by the total number of pull requests (excluding revert PRs).
We don’t want to see speed increase at the expense of quality, which is why PR Revert Rate is an important metric to monitor. In many customer environments, AI drives measurable gains in speed (as shown by metrics like TrueThroughput or PR Cycle Time), but it can also lead to more rework. This uptick in reverts can signal a potential drop in quality.
PR Revert Rate should never be viewed in isolation. Pairing it with other metrics, such as Change Failure Rate and Codebase Experience, provides a fuller picture of AI’s impact on quality. This helps determine whether AI is truly affecting quality across the board, or if it’s simply introducing a new workflow where developers rework code more frequently than before.
Developer Experience Index (DXI)
The DXI is a composite measure of key engineering performance factors, like test coverage, change confidence, and more, that are directly linked to financial impact.
DXI scores have been shown to have a strong correlation with time loss: every one-point increase saves 13 minutes per developer per week, adding up to about 10 hours annually. Because DXI can be tied directly to dollars, it gives leaders a clear way to quantify and communicate the ROI of improvements.
When introducing major changes—such as adopting AI tooling—tracking DXI is essential to understand the impact on engineering effectiveness. In a successful rollout, DXI should rise, or at least hold steady.
Percentage of Time Spent on New Feature Development
The percentage of feature development metric in DX tracks the amount of time spent working on new features and capabilities, relative to other tasks such as support, bug fixes, and maintenance work. We see customers using this metric to understand whether AI is helping automate toil or bug fixes and freeing developers to spend more time developing new features and products.
A final reminder: Measure in context
As always, we recommend a balanced, multi-dimensional approach to measuring developer productivity—and that doesn’t change with the introduction of AI. To truly understand AI’s impact, leaders should track measures of speed, effectiveness, and quality together to get the full picture.
While AI doesn’t change how we think about measuring developer productivity, it does introduce the need for unique metrics to capture its specific effects. This article highlights several metrics our customers find valuable, and we recommend pairing them with the rest of the metrics in the AI Measurement Framework for a complete view.
To start tracking these metrics, request a demo or speak to your customer success representative.