AI tooling benchmarks: PR throughput and usage by tool (Q1 2026)
Updated data from a sample of 64,680 developers across 219 companies.

Justin Reock
Deputy CTO
This post was originally published in Engineering Enablement, DX’s newsletter dedicated to sharing research and perspectives on developer productivity. Subscribe to be notified when we publish new issues.
One of the insights from the AI impact report released last quarter was that newer AI-native tools appeared to be outperforming others (see page 14). Even in side-by-side deployments, AI-native tools like agentic IDEs were associated with higher throughput compared to older or less specialized solutions.
Given how quickly the space is evolving, we decided to revisit this data to see whether those patterns still hold. In this latest analysis, we looked at PR throughput and median adoption rate across a slightly larger sample of companies (219, versus the 170 we examined last quarter). Here’s an updated look at what we’re seeing:
Comparing our latest Q1 2026 data to our Q4 2025 report we observe a performance jump consistently across all tools. This indicates that trends from last quarter’s data are continuing, and that stronger performance is being realized as tool maturity and adoption practice improves.
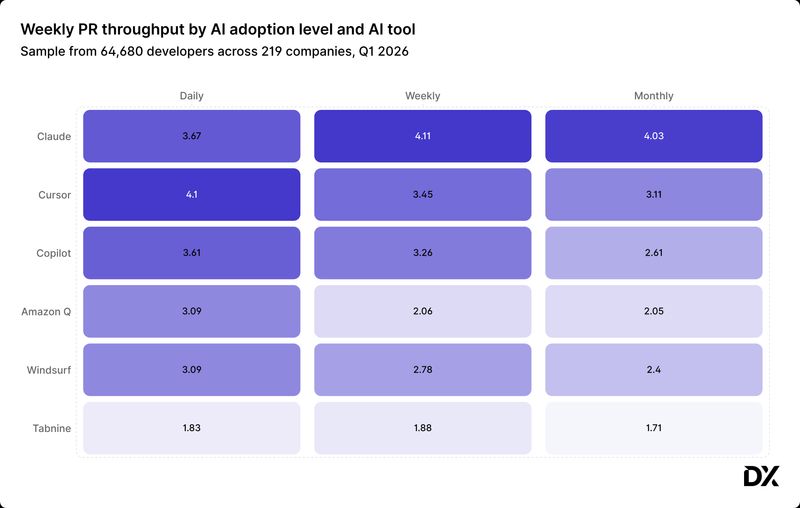
It’s notable that the throughput rankings themselves have not changed over the last three months, with newer, agentic tools still ranking highest in terms of velocity impact. Regardless of overall rank, we observed velocity increases across every tool, with a few major shifts since Q4 2025:
- Cursor has seen the largest increase in PR throughput. In Q4 2025, daily users merged a median of 2.8 PRs. Today, that number has jumped to 4.1, representing a 46% increase in throughput for frequent users.
- Claude leads for weekly and monthly users, with PR throughput exceeding 4.0. This is a significant move from the 2.6 (weekly) and 2.2 (monthly) reported just one quarter ago.
- GitHub Copilot daily users have also accelerated, moving from 2.5 PRs/week in Q4 to 3.61 today.
- Tabnine continues to show the lowest throughput at 1.83 for daily users. As noted in the previous report, this is likely because Tabnine is common in large enterprises where PR throughput is lower overall due to organizational complexity.
The last quarter of 2025 has been a landmark period for AI, with broader industry education and best practice converging with improved models, like Opus 4.5 and GPT-5.2, and better tool workflows such as those found in Cursor’s Agent Mode and Claude Code’s spec-driven focus.
Despite rapid advancement and innovation, many unsolved problems remain. Limitations such as memory and context constraints provide technical hurdles, while lack of organizational alignment on policies and practices continue to drive cultural challenges. With all this opportunity for improvement, I expect to see deliberate advancements continue, and productivity gains rise even further in the coming months.
While we were analyzing PR throughput data associated with different AI tools, we also looked at which tools are becoming daily drivers. (Note: adoption metrics don’t directly reveal productivity impact, as is mentioned in the DX AI Measurement Framework. But adoption metrics can give us a signal into which tools are being used for daily tasks versus those used only for specialized, less regular tasks.)
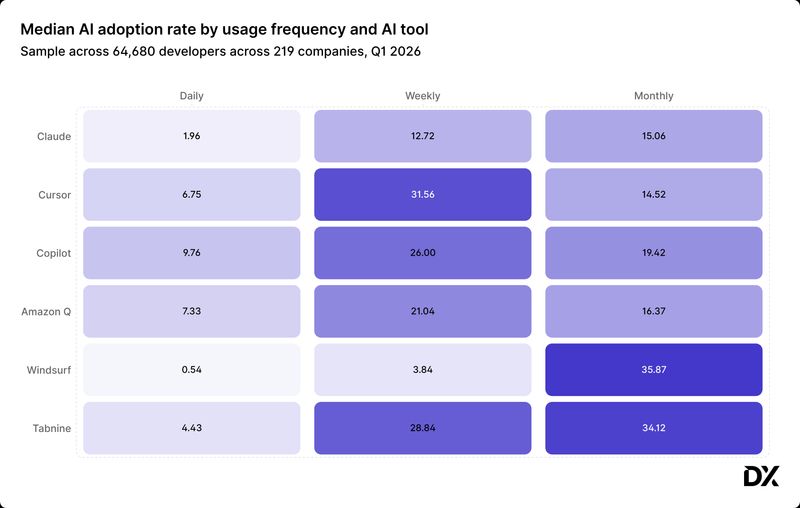
- GitHub Copilot remains the leader in overall stickiness, with the highest daily adoption rate at 9.76%. Its integration into the existing workflow may be helping it become a constant companion for developers. Additionally, for many businesses, Copilot is easy to procure since an existing purchasing agreement with Microsoft is likely to already be in place.
- Cursor is rapidly becoming a primary workspace, boasting an impressive 31.56% adoption rate among weekly users.
- Windsurf and Tabnine show a longer-tail adoption pattern. Windsurf, in particular, has the highest monthly adoption at 35.87%, suggesting it is being used as a powerful specialized tool for specific complex tasks rather than a total IDE replacement for most.
Summary
The data provides evidence for the belief that organizations will realize greater productivity gains as developers become more familiar with AI tools. Further, the significant jump we see in throughput shows how quickly the space is advancing. It’ll be fascinating to watch and see whether we see even higher throughput numbers next quarter, or gains will start to level over time.
I’ll conclude with a few reminders on how to use this data:
- Correlate usage with throughput: Don’t just measure seat count. Ensure that your highest-cost tools are being used by your Daily or Weekly cohorts where the throughput gains are most visible.
- Avoid vendor lock-in: Because the performance of these tools is evolving so quickly, we recommend a multi-vendor approach. Different tools excel at different frequencies (e.g., Copilot for daily assistance, Claude for weekly deep-dives). See our webinar on data-driven evaluations of AI tools for more information.
- Measure to confirm ROI: Use these benchmarks to establish a baseline for your own organization. While AI metrics tell you what is happening, your core metrics, like PR throughput, confirm whether the investment is actually working.