How to implement the AI Measurement Framework in DX

Leo Epstein
Product Marketing
DX recently released the AI measurement Framework, a set of research-based metrics for measuring and optimizing the impact of AI code assistants and agents.
The framework provides metrics that span three dimensions—utilization, impact, and cost—for fully understanding the impact AI tools are having. These dimensions also follow the typical adoption journey we see organizations follow: they start by focusing on usage, then shift to measuring impact, and finally to understanding and optimizing ROI.
This article is written for DX users, and will describe how to find and capture each metric in the framework within DX.

Measuring AI adoption in DX
In the framework, we recommend four primary metrics to understand how developers are adopting AI tools:
- AI tool usage, or the number of daily active users (DAU) or weekly active users (WAU)
- Percentage of PRs that are AI-assisted
- Percentage of committed code that is AI-generated
- Tasks assigned to agents, a metric for the number of tasks assigned to autonomous agents
Here’s how to capture each metric in DX.
AI tool usage
Go to your Reports tab, then navigate to the AI Utilization dashboard. This view shows AI tool usage across all AI tooling, including bespoke internal AI tools, by daily or weekly active users.
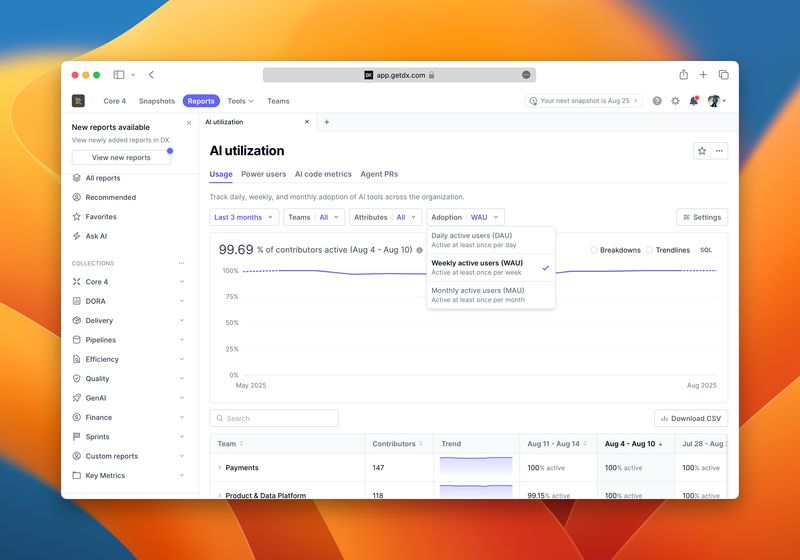
DX’s reporting on AI tool usage is unique in that we provide data on daily, weekly, and monthly logins to track adoption rate. This differs from the out-of-the-box reporting provided by many AI vendors, who may be referring to total logins. Total logins can be misleading: if a developer logs into an AI tool once, that is not the same type of adoption as someone who is actively using multiple tools on a daily or weekly basis.
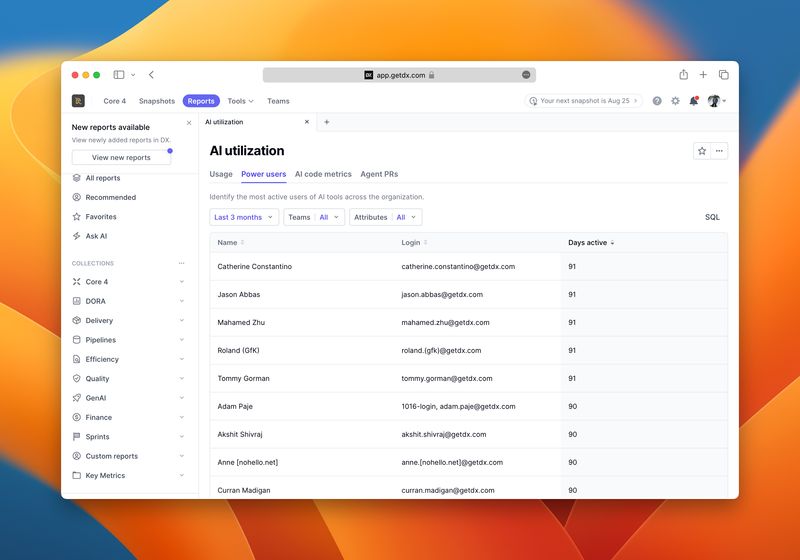
DX also places developers into cohorts based on their usage: no adoption, light, moderate, or heavy. This makes it easy to see how metrics change as adoption increases. You can also drill into the AI tool power users view—found under the AI Utilization page—to identify your most active adopters. These power users can serve as internal champions, helping to share best practices and accelerate adoption across your teams.
Percentage of AI-generated code
Many organizations want to track how much of their code is being generated by AI (or more specifically, the percentage of PRs that are AI-assisted, and the Percentage of committed code that is AI-generated).
At DX, we’ve developed file system-level observability technology that detects the difference between human typing and AI-generated batch modifications by analyzing the rate and pattern of file changes in real-time. This approach works across all IDEs, AI tools, and CLI agents, giving you unified visibility into AI code generation regardless of which tools your developers use.

This feature in DX gives you precise tracking down to the commit, user, repo, and branch level, helping answer questions like:
- How much of our code is generated by AI?
- Which tools are developers actually using?
- Where is AI helping—or potentially hurting—our codebase?

Tasks assigned to AI agents
We’re building this functionality into DX alongside the technology described above. To get early access, request a demo or contact your Customer Success representative.
Measuring the impact of AI in DX
Adoption is just the beginning—real impact comes from using data to inform strategic enablement, skill development, and high-leverage use cases. To understand how AI tools are impacting software delivery, we recommend the following metrics:
- AI-driven time savings: a measure of the time saved across the SDLC by developers using AI
- Developer Satisfaction: a measure of developer satisfaction with AI tooling through the use of CSAT questions as part of the quarterly snapshot
- Correlations between AI usage and measures of developer productivity (i.e., the DX Core 4 metrics)
- Human-equivalent hours of work completed by autonomous agents
AI-driven time savings
To view AI-driven time savings in DX, head to the AI Impact Report and select the Time Savings tab. DX calculates these savings quarterly and lets you filter by AI tool usage cohort, team, or custom developer attributes, making it easy to understand which groups of developers save the most time by using AI. This can include data on different AI tools’ time savings generated, not just overall time savings. 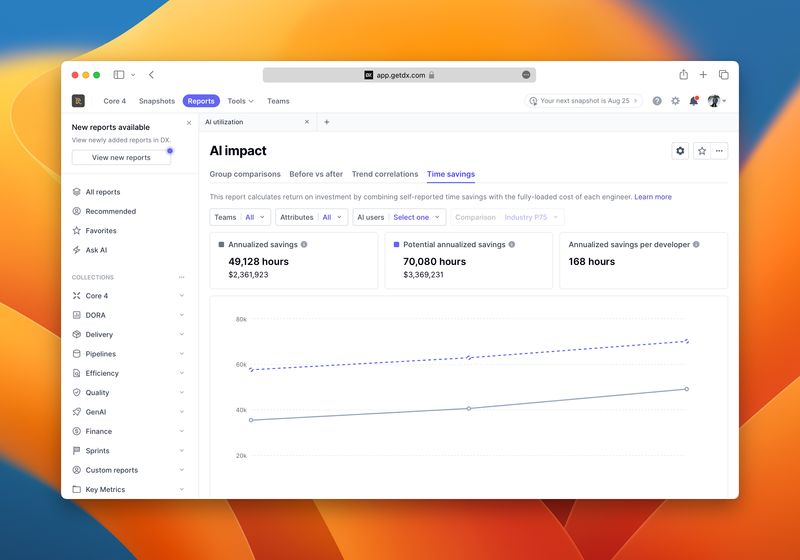
Developer satisfaction with AI tools
As part of DX’s snapshot, developers’ satisfaction with AI tools is measured on a quarterly basis. Developer satisfaction with AI tooling can be measured per each individual tool, or in total. As more AI tooling is adopted across the organization, individual satisfaction scores for each tool become more useful for direct comparisons.
DX Core 4 metrics
The DX Core 4 is a framework for measuring developer productivity that encapsulates DORA, SPACE, and DevEx. By comparing AI usage to the DX Core 4 metrics, leaders can see the impact AI is having on productivity.
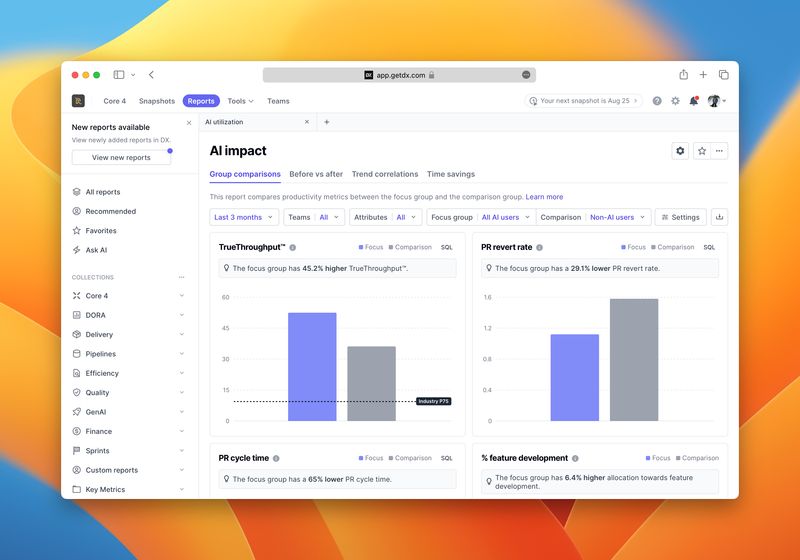
In DX, navigate to Reports, then the AI Impact report to compare AI usage across the DX Core 4 metrics impacting speed, effectiveness, quality and business impact. By using filters, you can compare AI users versus non-users, and heavy users versus moderate users; you can compare usage across teams, and you can compare vendors against each other.
This report includes metrics such as PR Throughput, Change Failure Rate, Developer Experience Index, Percentage of Time Spent on Feature Development, and more. These metrics help you compare AI usage against measures of speed, effectiveness, quality, and impact.
Another view we see customers finding value in is the before-and-after trend analysis tab. You can use this report to visualize how these measures of developer productivity trend as different cohorts of developers become heavier users of AI tools. This view, especially with the ability to break down by team or custom attribute, is particularly helpful for measuring the impact of enablement efforts.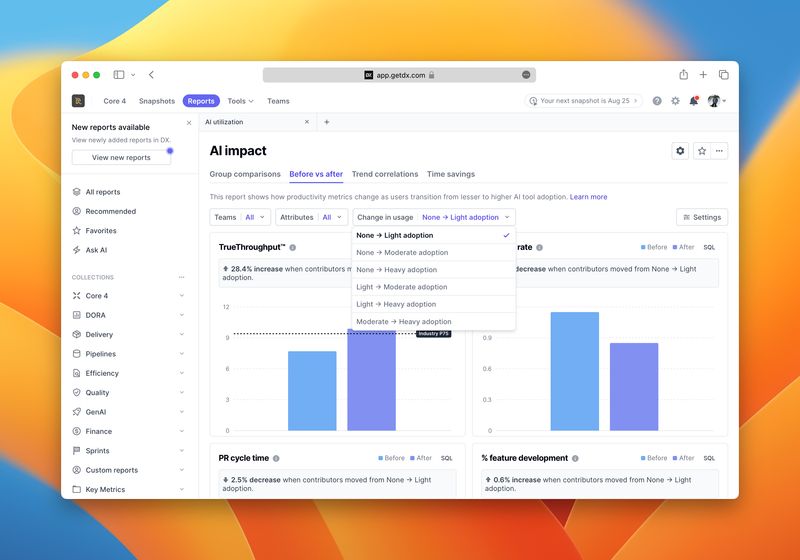
Human equivalent hours of work completed by agents
We’re building this functionality into DX. To get early access, request a demo or contact your Customer Success representative.
Tracking AI tooling ROI
We’re actively focused on helping teams understand and optimize AI costs. While the level of detail available depends on what vendors provide, DX can import data into custom tables to track AI tooling spend. Over time, we plan to expand the insights we offer in this area so you can make even more informed decisions about your AI investments.
Get started today
With comprehensive visibility into AI adoption and it’s impact on productivity, engineering leaders can identify which tools drive results, which teams are succeeding, and how to scale those practices across the organization.
If you aren’t capturing these metrics today, please speak to your DX Customer Success representative or book a demo of DX today.