How 18 companies measure AI’s impact in engineering

I recently wrote a guest post for The Pragmatic Engineer, where I shared the metrics that 18 companies use to measure AI’s impact on software engineering. Go here the full article, or continue reading for a summary.
Over the past year, headlines about AI in software engineering have been dominated by one statistic: how much code these tools can generate. Google says 25% of its code is AI-authored, Microsoft says 30%. Founders have declared AI will replace junior engineers.
At the same time, studies such as the recent METR report show that AI can distort our time perception, making us feel faster when we may actually be slower.
The problem is not that these numbers are false, it’s that they are incomplete. Measuring AI impact by adoption metrics alone tells us little about whether organizations are building higher-quality software, moving faster to market, or creating a sustainable developer experience.
Earlier this year, I co-authored the AI Measurement Framework, which is a recommended set of metrics to track AI adoption and impact across engineering teams. This framework is built upon rigorous field research, as well as data analysis from 400+ companies, and how they’re actually rolling out and measuring AI tools. This article shares how 18 companies measure AI impact in the real world, giving you a peek into the research that goes into something like the AI Measurement Framework.
What leading companies measure
The good news is that some companies are further ahead. In research I conducted across 18 organizations—including Google, GitHub, Dropbox, Microsoft, Atlassian, and Booking.com—several consistent patterns emerged.
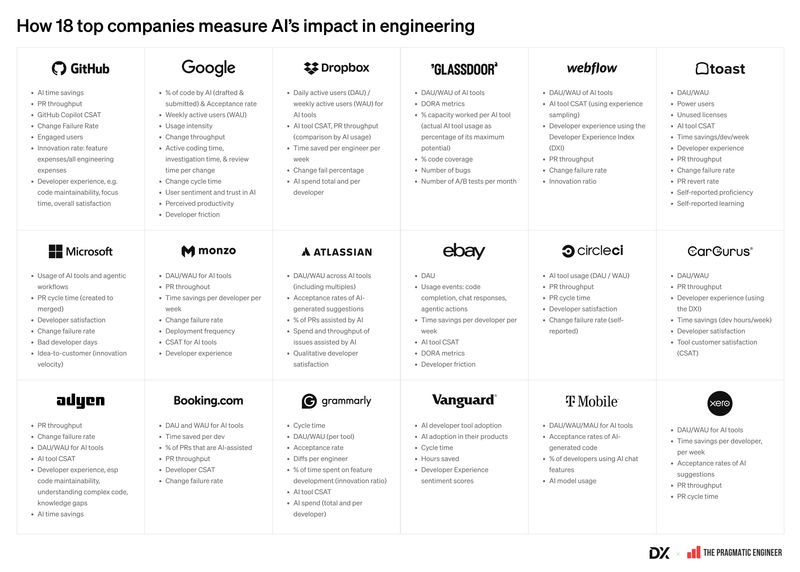
- Solid foundations first. AI does not change what makes good software good. Core metrics—pull request throughput, cycle time, change failure rate, and developer experience—remain critical. These provide the baseline against which AI’s impact can be judged.
- AI-specific metrics add visibility. Leading companies track who is using AI, how much work is touched by AI, the time saved, and the cost. Dropbox, for example, tracks daily and weekly active AI users, AI tool satisfaction, time saved per engineer, and spend. By combining these with its Core 4 framework (speed, quality, effectiveness, and experience), Dropbox can see whether high adoption rates translate into meaningful performance gains. The results: engineers who regularly use AI ship 20% more pull requests while also reducing change failure rate.
- Comparisons and cohorts matter. Companies are slicing metrics by AI vs. non-AI users, by tenure, role, and language, and by before/after adoption. Webflow used this approach to discover that engineers with three or more years at the company benefit most from AI, showing roughly a 20% increase in throughput.
Balancing speed, quality, and experience
Almost every company in the study measures speed and quality side by side—for example, tracking pull request throughput alongside change failure rate. This prevents over-indexing on one dimension while ignoring long-term risks like tech debt.
Beyond system metrics, leaders are also paying attention to developer experience. Measures like change confidence, code maintainability, and satisfaction with AI tools provide critical counterbalances. These can only be gathered through surveys or experience sampling, not telemetry.
As Shelly Stuart, Director of Engineering at CircleCI, put it: “Developer experience tells us the story behind the numbers. While output metrics show what is happening, developer satisfaction reveals whether it’s sustainable.”
Unique approaches
Some organizations are experimenting with unique metrics:
- Microsoft tracks “Bad Developer Days” to assess whether AI reduces friction in developers’ daily work.
- Glassdoor measures experimentation by counting monthly A/B tests, using AI as a driver of innovation.
- T-Mobile and others still track suggestion acceptance rate, but increasingly as a proxy for satisfaction rather than productivity.
- Shopify uses leaderboards to celebrate experimentation, while others are beginning to scrutinize spend as AI budgets double year over year.
Looking ahead, measurement will need to expand beyond coding. Agentic workflows, planning, code reviews, and incident management will demand new metrics in 2026 and beyond.
Final thoughts
The right question is not “how much AI code are we shipping?” but: “Is AI making us better at the things that already matter—quality, speed, and frictionless developer experience?”
For leaders beginning this journey, here are the questions to ask:
- Do we have a clear definition of what engineering performance looks like?
- Do we have pre-AI baselines to compare against?
- Are we mistaking AI activity for AI impact?
- Are our metrics balanced across speed, quality, and maintainability?
- Can we see how AI tools affect the developer experience?
The companies furthest ahead are not those with the highest percentages of AI-generated code. They are the ones asking the right questions, measuring impact holistically, and adjusting their strategies based on evidence rather than headlines.