State of AI Impact in Engineering:
Q2 Report
Analysis of 500+ organizations finds AI spend up nearly 28x, while innovation remains flat.
Download PDF

Justin Reock
Deputy CTO
Executive summary
Engineering organizations have entered a critical transition phase, shifting their focus from measuring baseline AI adoption to evaluating concrete return on investment. With AI utilization now above 90% across the industry, the question engineering leaders face is no longer “are we using AI?” but “is it paying off?”
This quarter’s data shows a system in tension: code output is climbing, cost is climbing faster, and the human experience of building software has not kept pace with either. While AI tools are accelerating individual output, the surge in AI-generated code is testing the limits of existing infrastructure and human review gates.
This report measures 500+ organizations against the DX Core 4 (Speed, Effectiveness, Quality, Impact) and the DX AI Measurement Framework (Utilization, Impact, Cost). Four distinct themes have arisen from the data this quarter:
1. Speed gains are real but uneven
- Median weekly TrueThroughput rose 37% over four quarters (1.42 to 1.94 PRs/eng/week), and deployment frequency is up across most segments.
- However, gains are concentrated among small organizations (less than 100 engineers) and tech-sector teams, pulling away from larger and traditional-industry teams, and the gap is widening.
2. AI is improving some aspects of developers’ work while creating new bottlenecks in others
- Documentation quality, code maintainability, and production debugging all improved, and represent the clearest, least-contested wins in this report.
- Incremental delivery, local iteration speed, and review turnaround all declined, and the average Developer Experience Index (DXI) slipped from 67 to 65. PR size nearly doubled over the same period, consistent with AI-driven inflation rather than disciplined, testable code.
- AI is making individual tasks faster, but the surrounding system is absorbing the slack rather than converting it into new value. This is the same “AI efficiency paradox” now being documented industry-wide: individual output surges while human gates become the new bottleneck.
3. Code is easier to read but harder to trust
- Code maintainability improved, but change confidence fell in the same period. These metrics are historically correlated, but are now in tension. AI can help engineers understand and change the code in front of them, but faith in the output and trust in the code is slipping.
- Change failure rate volatility increased, with many organizations now reaching +/-3 percentage points against a 4% industry benchmark. AI has not created this volatility, but it has amplified it.
- Perceived software quality tells a counterintuitive story: Traditional industries and Financial Services, the slowest-moving segments on throughput, report the highest perceived quality. Speed and perceived quality are not moving together, and leaders should not assume they will.
4. Spend is outrunning the return it’s meant to justify
- Median quarterly AI spend grew from ~$1.5K to ~$44K in a year, roughly a 28x increase in the Tech sector alone, while the innovation ratio (time spent on creating new features vs. maintenance) has stayed essentially flat over the same four quarters.
- Time savings are real and growing, now over 6 hours a week on average, but saved hours are not yet visibly converting into new value creation at the portfolio level.
- Smaller organizations pay more per seat for AI tools, since they lack the negotiating leverage larger companies get from volume licensing. Yet they’re getting more output per dollar spent than larger companies. This challenges the common assumption that scaling up AI spend at the enterprise level will automatically improve ROI. The data suggests the opposite: bigger AI budgets don’t guarantee better returns, and may even come with diminishing ones.
The bottom line for leaders
AI has accelerated code-writing, but is not yet translating into faster felt delivery, higher innovation capacity, or spend that has proven its return. The organizations best positioned going into the remainder of the year are treating AI adoption as the starting line, not the finish line. Leaders should pair every throughput or spend metric with a quality and experience counterweight (change confidence, DXI, innovation ratio, etc), and invest as much in the surrounding environment and platform as in the AI tooling itself.
Introduction: The ubiquity era of AI
Welcome to our Q2 AI impact report, the third edition of our quarterly AI industry analysis. When we began this project, the primary goal was to study and publish what happens to a team’s output after they adopt generative AI. For the past two quarters, answering that question meant measuring AI cohorts against historical baselines, representing engineering performance pre- and post-AI adoption.
With industry-wide adoption hovering well above 90%, we’ve reached an inflection point where we can no longer treat AI utilization as a binary condition, and as a result, this structure for comparison is no longer viable. Because utilization is essentially ubiquitous, we are absent a control group, so comparing impacts across cohorts tells us very little now.
This quarter, we are uncovering entirely new insights by shifting our lens toward deeper firmographic and demographic segmentation, measuring exactly how AI impact is shifting across different organization sizes, geographies, and industry verticals. Additionally, we are able to report on a more even blend of qualitative insights and system metrics than in previous reports. We have also updated the format of this report to better represent how AI augments various aspects of the SDLC.
As AI becomes infrastructure rather than experiment, engineering leaders are under pressure to justify massive AI budgets. The instinct is to reach for new metrics like token counts and lines of AI code, but new metrics only indicate how work is changing, not whether it’s producing better outcomes. A 90% AI adoption rate means nothing if delivery stalls or system stability crashes.
This is why outcome-oriented measurement frameworks matter more, not less, in the age of AI. While AI represents a shift in how software is built, it does not alter what engineering organizations are ultimately trying to accomplish. The questions engineering leaders need to answer remain the same: How quickly is value delivered? How easy is it for developers to do their work effectively?
Answering these questions demands measurement frameworks that are outcomes-driven and grounded in peer-reviewed research, not reactive dashboards built around the latest hype cycle. The two frameworks underpinning this report, the DX Core 4 and AI Measurement Framework, were designed to meet those standards.
The data from this report reveals that AI is delivering objective gains in velocity, but those gains are highly uneven. Systemic bottlenecks, like meeting bloat and code maintainability, still eclipse the time savings and acceleration experienced at the level of individual productivity. Additionally, key aspects of developer experience are seeing new tensions that require shifted attention from leaders.
Part I: DX Core 4
Speed · Effectiveness · Quality · Impact
The DX Core 4 focuses our evaluation on the structural pillars of engineering health: Speed, Effectiveness, Impact, and Quality. This ensures we aren’t just looking at isolated coding habits, but instead validating whether AI investments are driving gains in organizational productivity.
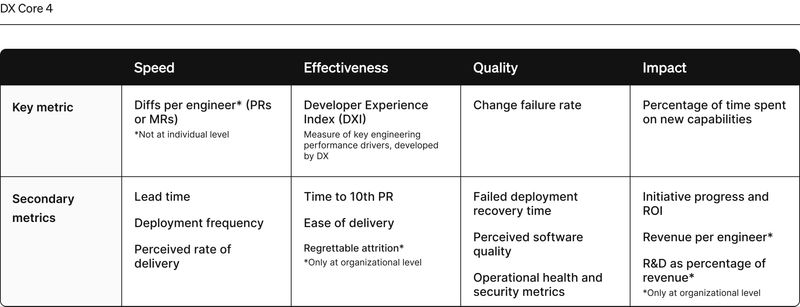
Speed
Velocity continues to increase, extending a steady quarter-over-quarter growth trend observed since Q3 2025. However, the data highlights a divergence between objective system metrics and subjective developer perception. Measurable pipeline acceleration has not yet translated into developers reporting a higher perceived rate of delivery.
Furthermore, these speed improvements are distributed unevenly across market segments. Smaller organizations and Tech-industry teams are currently recording the highest throughput gains, whereas larger and Traditional-industry teams are demonstrating slower, more incremental progress.
While these metrics demonstrate a clear increase in output, velocity alone does not fully indicate the total value generated by AI investments.
Primary metric: Median weekly PR throughput
To understand directional changes in engineering velocity, DX utilizes TrueThroughput™, which incorporates code diff complexity analysis. By weighing the resulting metric based on this complexity, it provides a much more accurate reflection of developer effort than treating all pull requests equally. TrueThroughput generally skews lower than traditionally calculated Pull Request (PR) throughput.

Developers are shipping measurably more code. Median weekly TrueThroughput increased from 1.42 to 1.94 weekly PRs per engineer (PRs/eng/week) over four quarters, spiking particularly in the last two, representing a 37% increase in output. While the absolute change appears to be small, that increase becomes meaningful at scale.
However, the gap between the smallest and largest organizations is widening, indicating that scale and process overhead continue to dampen throughput gains for larger teams. Small-to-midsize (SMB) organizations (15-99 engineers) lead the pack, hitting ~2.2 PRs/eng/week in Q2 2026, while larger environments (750+ engineers) lag at 1.2 PRs/eng/week. Medium-sized organizations (100-749 engineers) saw the sharpest acceleration between Q4 2025 and Q1 2026, pointing to a potential inflection point for mid-tier teams.

There are measurable differences across industry verticals. Tech companies consistently outpace Traditional industries, and the gap between them is growing. While Traditional industries are improving, their rate of progress is roughly half that of the Tech sector. Tech climbed from 1.5 to 2.1 PRs/eng/week, whereas Traditional moved from 0.97 to 1.2 PRs/eng/week during the same timeframe.
- Tech companies: Organizations whose primary business is building and selling software or technology products and services. This includes software development, IT services, cloud infrastructure, and platform companies.
- Traditional companies: Organizations in non-technology-native industries where software engineering supports the core business. Examples include Retail/eCommerce and Manufacturing.

Breaking this data down further by specific industry verticals highlights that while growth is broad-based across all segments, the baseline TrueThroughput highly depends on the specific operational realities of the sector. Healthcare has emerged as this quarter’s throughput leader, outpacing historically fast-moving segments like Software Development & IT. Conversely, highly regulated sectors such as Financial Services continue to post the lowest overall throughput, reflecting the systemic constraints and compliance requirements inherent to their release pipelines.
For DX users: To track TrueThroughput over time, navigate to Reports > Core 4 > PR Throughput
PR throughput reflects how much code is moving through a system, not necessarily how fast value reaches users. We report it here as a well-established leading indicator of development activity, while necessitating teams interpret throughput gains in concert with other metrics. Uber’s new AI-native measurement framework combines velocity and value to point towards a new north star: feature velocity.
Secondary metric: Deployment frequency

Deployment frequency, a primary DORA metric, has increased by double-digits across most segments, confirming the upward trajectory of actual output.

Medium-sized organizations are the clear acceleration story, sustaining outsized gains in deploy cadence across three consecutive quarters (+26% to +68% to +61% QoQ). Larger teams showed a rebound to +14% in Q2 2026, signaling potential progress in overcoming scale-related release management bottlenecks. In contrast, SMB’s deploy frequency growth is modest and nearly flat in Q2 2026, suggesting these teams may have already reached their practical deployment ceiling.

This industry breakdown illustrates how different verticals manage release frequency. The massive acceleration in deployment pipelines varies heavily depending on the regulatory and architectural constraints inherent to each specific sector.

Regional deployment metrics show a divergence from the metrics segmented by size and region, displaying acceleration only across some tracked geographic segments. Silicon Valley-based organizations exhibited the sharpest increase, showing a dramatic spike in their deployment cadence by Q2 2026. Conversely, regions such as Europe began the tracking period with a higher baseline frequency but have remained relatively flat over the last two quarters. Meanwhile, Asia-Pacific and non-Silicon Valley North American teams continue to demonstrate steady, incremental growth.
For DX users: Reports > DORA > Deploy frequency
Secondary metric: Perceived rate of delivery
Despite objective gains in throughput and deployment frequency, developers’ internal sense of their delivery speed has not meaningfully shifted. The median perceived rate of delivery has held remarkably steady at roughly 67% to 70% across all four quarters. Most developers cluster tightly in the 60% to 75% range, showing that measurable pipeline acceleration does not automatically translate to a frictionless developer experience. Persistent outliers on both ends of the spectrum seem to reflect individual or team-level variations in workload and blockers rather than market-wide sentiment shifts.

For DX users: Reports > Efficiency > Perceived rate of delivery
Effectiveness
The primary metric used for engineering effectiveness is the Developer Experience Index (DXI), which is a weighted average of qualitative drivers which together represent a comprehensive view of the developer experience in an organization. The DXI can be used as a check against the assumption that more code output equals a better overall developer experience.
In Q2 2026, we saw a measurable drop in this score overall, explained by a cumulative drop in developer experience dimensions such as cross-team collaboration, review turnaround time, and incremental delivery.
A single-percent drop in the DXI represents the loss ofroughly10 hours time annually per engineer to sources of friction, toil, and bottlenecks in the engineering process. These losses nullify aspects of the velocity gains, leading to outcomes that aren’t always aligned with increases in speed.
Primary metric: Developer Experience Index (DXI)
Overall median DXI shifted from 67 in Q3 2025 to 65 in Q2 2026, falling consistently from Q4 2025 to our present dataset. On its own, this is concerning, but the potential risk is further elucidated when we analyze each individual DXI factor.

Individual developer experience factors
We have broken down the DXI into its individual factors, and calculated the impact to those factors over the same period, from Q3 2025 to Q2 2026. Studying this data, we see disparity across all factors, with some areas impacted positively, but many more impacted negatively.

Gains in several factors
The drastic increase in Documentation quality is clear. Given the strong utility of AI for assisting in documentation generation, a gain this substantial is expected, and leaders should continue to build documentation-generation into their AI strategy. There are also notable gains in areas such as Code Maintainability and Production Debugging.
These gains, however, are eclipsed by degradation in other key drivers such as Incremental Delivery, Local Iteration Speed, and Review Turnaround time.
Varied impact on quality
DXI tracks software quality through two primary metrics: Change Confidence (developers’ trust that their changes won’t break things) and Code Maintainability (how easy the codebase is to understand and modify). During this period, the two told opposite stories. Code Maintainability improved by 3.8%, while Change Confidence fell by 6.1%.

Code Maintainability indicates the ease in which code can be understood by developers, something augmented by coding assistants and agents, and that unsurprisingly has improved as a result.
By contrast, Change Confidence measures whether developers feel confident making changes to that code without accidentally breaking things. While AI is making it easier for developers to understand what’s in front of them, the data suggests that they have less trust in the code they are actually pushing into production.
Worsened incremental delivery
The sharpest decrease is in Incremental Delivery, which asks developers whether they work on small, incremental changes to the system. This metric measures healthy PR Throughput, following a practice of creating PRs that are scoped to a single, testable problem. When cross-referenced with the Quality → PR Size section later in this report, an increase in this metric points to a broader trend of PR bloat.
This is a combined result of multiple behaviors such as:
- Verbose code generated by AI models
- A temptation to increase batch size because of AI code generation
- Agent-generated PRs leading to more functionality added per PR
- “Over-engineering” of solutions by agents and assistants
To add to this problem, the data also shows increases in Build and Test time, as well as a sharp decrease in Local Iteration Speed. These are factors that research from multiple organizations associated with shipping larger batches. If a developer is anticipating an hour-long build cycle, they will naturally include more functionality per build, rather than waiting on multiple hour-long builds to complete.
A larger, less incremental PR means a longer review cycle, a more complicated merge and test set, and a more difficult time debugging and reverting changes when necessary.
Validating AI investments with developer sentiment
BNY used DX survey data to pinpoint where engineers experienced the most friction across their software delivery lifecycle, ensuring investments targeted real pain points rather than chasing trendy AI use cases. This sentiment-driven prioritization gave the team the confidence to codify AI into every step, from planning and peer review to testing, change management, and compliance, because they could validate which processes were bottlenecks.
By grounding their strategy in developer experience data, BNY moved beyond isolated coding assistants to a systematic approach to AI-assisted delivery across 8,000+ engineers. Read more about their process.
For DX users: Reports > Core 4 > DXI
Secondary metric: Time to 10th PR
In Q1, we reported that time to 10th PR, an onboarding signal measuring how long it takes new developers to merge their first 10 pull requests, had dropped from 39 to 33 days between Q3 and Q4 2025. This metric has been reduced by more than half since Q1 2024, before the use of AI was widespread in the industry.
Developer ramp-up time is one of the clearest, least-contested areas of AI impact. AI assistants and agents can help developers navigate unfamiliar codebases, interpret documentation, and produce acceptable code faster. As more agentic solutions are devised for onboarding processes we may see this figure continue to decline, though diminishing returns are inevitable as onboarding requires many steps that aren’t currently impacted by AI.
For engineering leaders, this is one of the strongest ROI arguments for AI investment: reduced ramp time directly translates to faster time-to-productivity for every new hire.

For DX users (Privileged users only): Tools > Onboarding
Secondary metric: Ease of delivery
Both a DXI driver and a secondary Core 4 metric, Ease of Delivery captures how frictionless it is for developers to move work from “ready to code” to “shipped.”
In an AI-augmented environment, this metric separates organizations that have embedded AI into their full SDLC from those that have only optimized the code-writing phase.
As the Q1 report made clear, non-AI factors such as CI wait times, meeting overhead, and unclear requirements still outweigh AI time savings. Ease of delivery is where those systemic inefficiencies show up.

AI can’t fix an inefficient CI/CD pipeline, approval chain, or misaligned staging environments. The overhead of software delivery, which the Q1 report framed as “non-AI factors still outweighing AI benefits,” remains a dominant drag on this metric. Organizations seeing the highest ease of delivery scores tend to be those that have also invested in platform engineering, developer portals, and process simplification alongside their AI rollout.
For DX users: Reports > Efficiency > Ease of delivery
Quality
In Q1, we flagged quality as “varied and volatile,” and that characterization has not softened. Change Failure Rate, which DORA describes as “the percentage of changes that result in degraded performance requiring immediate remediation,” remains the most unpredictable metric in the report.
Primary metric: Change failure rate
The data in our previous report showed some companies seeing change failure rate increases of nearly 2 percentage points. Positioned against an industry benchmark of 4%, that represents as much as a 50% increase in production defects. The Q2 data sees this trend continue, with new outliers extending into the +/-3% range.

Quality metrics are considered metrics that are oppositional to Speed metrics, and that’s highlighted in the tension this creates with the speed data above. Deploy frequency is rising across nearly every segment. TrueThroughput is up 37%. But if Change Failure Rate is simultaneously climbing for a meaningful subset of companies, then some organizations are simply shipping defects faster. This is the uncomfortable truth that the industry’s velocity-first narrative tends to gloss over: speed without quality discipline is not acceleration, its recklessness.
When visualized company for company, we see how wildly volatile this metric continues to be. It bears mentioning that this general pattern in Change Failure Rate has been observed prior to AI initiatives, but AI has increased the amplitude of this pattern.
Engineering leaders should be pairing every speed metric with a quality counterweight. If your team’s deploy frequency is up 60% but you’re not also tracking Change Failure Rate, recovery time, and rollback frequency, you have an incomplete picture of overall productivity.
For DX users: Reports > DORA > Change fail percentage
Secondary metric: PR size
In the same period of time that we’ve seen AI adoption explode, we’ve also seen PR size nearly double. This metric can serve as an early indicator of impending tech debt, and so this inflation is an immediate cause for concern.
Generally, more code can equal more complexity, less portability, and a greater potential for bugs and vulnerabilities. More verbose code can also be more difficult to review and maintain. One of the traits of a skilled engineer is the ability to fully implement a use case with exactly as much code as needed to perform the task. When AI undermines that instinct at scale, the result is not just technical debt. It is compounding cognitive debt across the team as engineers struggle to understand code they did not write.

For DX users: Reports > PR Size
Secondary metric: Failed deployment recovery time
Recovery time represents how quickly a team can restore service after a failed deployment. We’ve seen the distribution of recovery time lean towards longer recovery times, despite the qualitative signal that the Production Debugging DXI driver included above has improved by a small measure, as detailed above.


A team can tolerate a higher failure rate if recovery is fast and automated; conversely, even a low failure rate becomes costly if each incident requires hours of manual intervention.
As AI-generated code constitutes a growing share of production changes (now over 52% — see AI Utilization section below), the character of failures may also be shifting. Failures caused by AI-generated code may be more diffuse and harder to trace, particularly when the developer who merged the PR didn’t fully understand the code the model produced. This is a hypothesis worth tracking in future quarters.
For DX users: Reports > DORA > Failed deployment recovery
Secondary metric: Perceived software quality
Like perceived rate of delivery, perceived software quality captures developer sentiment and serves as an early warning system. If developers begin reporting that code quality is declining even as throughput rises, it’s a strong signal that AI-generated code is introducing maintenance debt that will compound over time. This is especially critical to monitor as AI-authored code crosses the majority threshold.


An interesting tension point is that the segments leading on Speed are not the segments leading on perceived quality. Traditional industries report higher perceived software quality than Tech in every single quarter (~77–79% vs. ~72–73%), despite Tech’s lead in TrueThroughput. The same pattern holds at the vertical level: Financial Services posts the highest perceived quality (~77–81%) while also posting the lowest throughput, and Healthcare, this quarter’s throughput leader, sits on the lower end of the perceived-quality range.
This is a clean, data-backed counter to the assumption that AI-driven speed comes without organizational cost. It doesn’t prove AI is degrading quality in fast-moving segments, but it’s exactly the kind of finding that should make engineering leaders ask the question of organizational impact before assuming the answer.
Knowing that traditional companies place a narrower focus on structured rollouts, AI included, and understanding that structured rollouts are positively associated with success in AI initiatives, it is perhaps unsurprising to see a greater perception of quality observed in traditional companies.


For DX users: Reports > Quality > Perceived quality
Impact
Key metric: Innovation ratio

Innovation ratio, the allocation of engineering effort spent on new feature work versus maintenance, toil, and operational overhead, is a critical output metric that connects AI investment to business outcomes. It’s also where the hype meets reality.
The innovation ratio (time on net-new value creation vs. keep-the-lights-on work) has been essentially flat for a year: ~57% in Q3 and Q4 2025 and slightly increasing to ~58% in Q1 and Q2 2026. Given how much of the AI narrative centers on “freeing developers up to innovate,” a flat-to-slightly-up trend over four quarters is a sobering data point worth stating without spin. The time AI is saving doesn’t yet appear to be reliably converting into a shift toward innovation work at the portfolio level.
AI’s promise has always been to free up developer time for higher-value work. The Speed data confirms that AI is accelerating the code-writing phase. But the Q1 report’s finding that non-AI factors (meetings, CI wait times, unclear requirements) still eclipse AI time savings raises a pointed question: is the time AI saves actually being reinvested in innovation, or is it being absorbed by the same organizational overhead it was supposed to eliminate?
The Atlassian Teamwork Lab refers to this as the “AI efficiency paradox” in their 2026 State of Teams report. This report surveyed 12,000+ knowledge workers and 170+ executives at Fortune 1000 companies and found that only 6% of executives feel confident that they can point to specific organization-wide AI ROI.
The Teamwork Lab found that “as AI helps individuals work faster, the surge of output backs up at reviews, approvals, and other human‑judgment gates, slowing down the flow and wiping out the speed gains.”
Engineering leaders should be tracking innovation ratio longitudinally. If it isn’t moving upward despite throughput gains, the organization has a prioritization problem, not a tooling problem.
For DX users: Reports > Core 4 > Innovation ratio
Part II: AI Measurement Framework
Utilization · Impact · Cost
The DX Core 4 focuses our evaluation on the structural pillars of engineering health: Speed, Effectiveness, Impact, and Quality. This ensures we aren’t just looking at isolated coding habits, but instead validating whether AI investments are driving gains in organizational productivity.
The DX AI Measurement Framework provides the vendor-agnostic architecture required to calculate true ROI by tracking tool adoption, measuring impact, and guiding AI investments at scale. When paired with the DX Core 4, this framework allows leaders to directly trace how individual AI utilization translates into broader organizational performance. Developed in collaboration with industry researchers, vendors, and enterprise leaders, this data-driven approach has a proven track record of guiding strategy at scale.
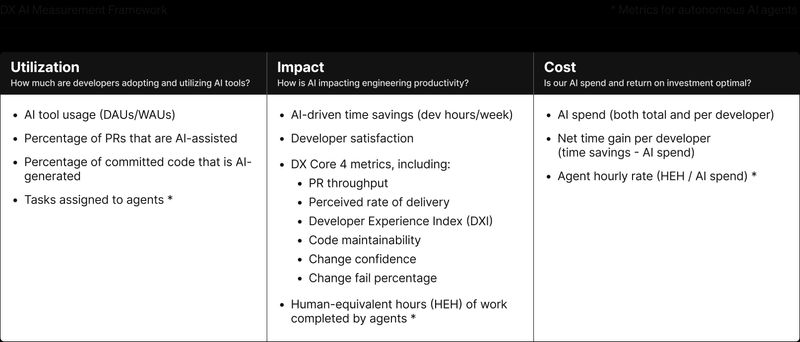
Utilization
AI tool usage (DAUs/WAUs)
With adoption above 90% industry-wide since Q1 2026, the utilization story has shifted from “are developers using AI?” to “how deeply is it embedded in daily workflows?” The density of weekly active users in this study provides the clearest picture yet of how saturated AI tool usage has become.
The strategic question is no longer adoption, its targeting and optimization. Leaders should be looking at the ratio of daily to weekly users within their own organizations. A high DAU/WAU ratio indicates that AI is embedded in routine workflows; a low ratio (high weekly, low daily) suggests that developers are experimenting but not yet integrating AI into their core development loop.

For DX users: Reports > AI Utilization > AI adoption
Percentage of code that is AI-generated
Across all developers in the study, 52.7% of code is now AI-authored. What is most notable is the sharp acceleration in this metric over the past three quarters. Looking at the distribution of the average percentage of AI-authored code, the volume has steadily surged from 24% in Q4 2025, to 34% in Q1 2026, before sharply spiking to 52% in Q2 2026. This steep trajectory suggests that once AI tools are available, the code they produce rapidly permeates the codebase, likely because AI-generated code flows through reviews, shared libraries, and collaborative workflows.
Consequently, organizations must recognize that AI-generated code is a collective, codebase-wide phenomenon rather than an isolated metric. This rapid saturation requires scaling quality infrastructure, code review norms, and testing protocols comprehensively across the engineering organization. Developers across the organization are now frequently reviewing, integrating, and maintaining code originally generated by AI, meaning the downstream impact on maintainability and technical debt applies to the entire team.

For DX users: Reports > AI Utilization > AI code percentage
Impact
AI-driven time savings
In Q1 2026, daily AI users saved an average of 4.72 hours per week, with the overall average at 3.9 hours. As models continue to improve and agentic workflows mature, we expect this number to continue its upward trend. This rate of increase may begin to plateau as organizations exhaust the easiest automation targets (code completion, boilerplate generation, test scaffolding) and move into more complex, judgment-intensive tasks.

Time savings are climbing steadily across every usage cohort, with no sign of plateauing yet. Heavy users are tracking toward roughly 6+ hours/week by Q2 2026, up from the 4.72 hours/week reported for daily users in Q1. However, time savings are only valuable if they translate into business outcomes. An engineer who saves 5 hours a week but spends those hours in additional meetings has produced no net value from the AI investment.
Leaders need to pair time-savings tracking with downstream metrics such as innovation ratio and customer-facing feature velocity to understand whether saved hours are being reinvested or merely reallocated.
For DX users: Snapshots > Workflows > AI time savings
Developer satisfaction
Developer satisfaction is a highly multifaceted concept. A developer’s daily satisfaction is influenced by numerous factors ranging from team culture and management practices to psychological safety and broader organizational investments in developer experience.
For this reason, in this analysis we use the percentage of developers who report being “highly energized by their work” as a generic proxy. This metric serves as a reliable indicator of whether developers continue to feel engaged in their daily tasks, regardless of the shifting toolscape around them.
The data paints a picture of stabilization. Despite the compounding downstream challenges detailed throughout this report, overall developer energy has demonstrated resilience, holding steady between 63% and 65% from Q3 2025 through Q2 2026.

While this report doesn’t demonstrate AI actively fixing or elevating engineering culture on its own, this data strongly suggests that AI is, at the very least, not making it worse. It appears that the localized benefits of AI are effectively offsetting the new systemic complexities it creates, ensuring that the baseline developer experience is successfully maintained.
For DX users (Privileged users only): Reports > Delivery > Attrition
Cost
AI spend (both total & per developer)
Cost is a dimension which will receive a lot of attention in the latter half of 2026 and beyond. As the initial hype begins to wear off, increasingly leaders will seek to understand whether the new R&D spend, in the form of AI tokens and subscriptions, will be in line with the desired outcomes such as improved feature velocity and an increased capacity for innovation, as discussed earlier in this report.
With median quarterly organizational AI spend data now available across 400+ organizations segmented by type, size, and region, leaders can benchmark their investments for the first time with real industry data.
The data reveals a dramatic spike in total spending, heavily skewed by the Tech sector, alongside a counterintuitive market inversion: the smaller organizations paying the highest premium per developer are currently extracting the greatest value.
Total organizational spend
Total organizational AI spend is accelerating rapidly as token usage expands across the software development lifecycle. Median quarterly organizational spend climbed from roughly $1.5K in Q3 2025 to nearly $44K by Q2 2026.

The growth in this AI investment is highly uneven across sectors. Tech-sector organizations are driving the spending spike, with quarterly spend jumping from around $1.4K to $45K over four quarters (an approximate 28x increase). Conversely, traditional industries grew far more modestly, reaching roughly $43K, an 8x increase from $4.3K from Q3 2025.

Larger organizations benefit from volume licensing and negotiated enterprise agreements, resulting in lower per-developer costs. Smaller organizations pay a premium on a per-seat basis, but, as the Speed data shows, are extracting more throughput per dollar. This creates an interesting inversion: the organizations paying the most per developer are getting the most value per developer.

Regional spending patterns highlight that AI costs are heavily influenced by local labor cost dynamics, vendor pricing strategies, and regional purchasing power. Global engineering leaders must ensure they are benchmarking their AI expenditures against regional output metrics, rather than relying solely on global averages that may skew their ROI calculations.

Viewing absolute spend by industry vertical highlights the variance in how aggressively different markets are capitalizing on AI, with specific sectors financially committing at significantly higher rates.

Per-developer spend
Breaking down cost on a per-seat basis reveals a critical inversion in the market. While smaller organizations lack enterprise negotiating power and are forced to pay a premium per seat, earlier Speed data confirms they are extracting more throughput per dollar spent.


Counterintuitively, the organizations currently paying the most per developer are also capturing the most value per developer. Process overhead at the enterprise scale continues to dilute the impact of their volume-discounted AI tools.

For DX users: Reports > AI Cost > AI cost management
Closing thoughts: Moving from adoption to ROI
The Q2 2026 data indicates a transition phase for AI adoption, shifting from base deployment to evaluating the concrete return on investment. While AI assistants are saving developers an estimated 4 to 6 hours per week, these time savings have not yet reliably converted into higher-level business outcomes.
Specifically, the innovation ratio has remained essentially flat over the past year, plateauing around 58%. Furthermore, the financial investment in AI has escalated significantly, with Tech sector quarterly spend increasing nearly 29x from $3M to $87M. This cost acceleration is outpacing the proportional gains in system throughput.
Engineering leaders must now focus on tracking whether saved hours are being reallocated to product innovation or if they are simply being absorbed by existing organizational friction.
Managing code volume and quality
With 52.7% of all codebase contributions now authored by AI, the characteristics of software quality are measurably shifting across the industry. Developers report that while AI improves overall code maintainability, their confidence in making changes to the system without breaking things has actively declined.
This bifurcation in key Developer Experience Index drivers aligns with objective system metrics demonstrating that pull request sizes have nearly doubled over the past year. The combination of larger batches of code and increasingly diffuse code provenance means organizations are facing evolving forms of technical debt.
While deployment frequencies have increased across most segments, change failure rates remain highly volatile, suggesting some teams are shipping defects at a proportionally faster rate. To address this, leaders should scale their quality infrastructure to match code generation speeds by incorporating AI-driven testing, standardized prompts, and updated code review protocols.
Optimizing flow and delivery
Despite objective acceleration in TrueThroughput and deployment frequency, developer perception of delivery speed remains flat at approximately 70%. This plateau indicates that the downstream phases of the software development lifecycle, such as CI/CD wait times and review latency, have become the primary constraints on delivery.
Interestingly, organizational scale also presents a friction point for AI ROI. Smaller organizations (SMBs), despite paying a premium per developer for AI seats, are currently realizing the highest throughput gains per dollar spent. In contrast, enterprise organizations continue to lag in throughput growth, indicating that scale and process overhead ultimately dampen the effectiveness of AI tooling. For engineering leaders, the strategic focus must shift from simply acquiring AI tools to optimizing the surrounding platform and development pipelines to ensure the generated code can be delivered and maintained efficiently.
Methodology
Sample
The dataset represents a combined sample of developers across 500+ engineering organizations that use the DX platform. Companies range in size from fewer than 50 to over 10,000 employees, represent a wide geographic spread from Europe to Asia to North America, and encompass many industries, including Finance, Retail/eCommerce, and Healthcare. Data covers the period of April 1, 2026 to June 30, 2026. Where trend comparisons are shown, historical data extends back to Q3 2025.
Company and industry classification
Sector
- Tech companies: Organizations whose primary business is building and selling software or technology products and services. This includes software development, IT services, cloud infrastructure, and platform companies.
- Traditional companies: Organizations in non-technology-native industries where software engineering supports the core business. Examples include Retail/eCommerce and Manufacturing.
Geographic regions
Data is disaggregated by the following regions based on company headquarters location: North America (broken down by Silicon Valley and non-Silicon Valley), Europe, Asia-Pacific, and Latin America.
Organization size
- Small to midsized organizations: Fewer than 100 engineers
- Medium-sized organizations: 100–749 engineers
- Large organizations: 750+ engineers
Where finer segmentation is shown (e.g., per-developer spend), ranges such as 15-99, 100-299, 300-749, and 750+ are used.
Key metrics and data sources
This report draws on two complementary data sources:
- System metrics: Quantitative metrics collected automatically from source control, CI/CD pipelines, AI coding tools, and other engineering systems. Includes TrueThroughput™, deployment frequency PR size, time to 10th merged PR, and weekly active AI tool users.
- Survey metrics: Developer feedback and experience data collected through DX’s research-based survey instruments. Includes the Developer Experience Index (DXI) and its 14 driver dimensions, self-reported time savings, perceived rate of delivery, perceived software quality, change confidence, code maintainability, ease of delivery, and innovation ratio
Analytical frameworks
Findings are organized around two frameworks:
- DX Core 4: Measures engineering productivity across four outcome dimensions: Speed, Effectiveness, Quality, and Impact. It synthesizes key principles from DORA, SPACE, and DevEx into a unified methodology designed for executive decision-making
- AI Measurement Framework: Provides diagnostic context for AI-specific telemetry across three categories: Utilization (adoption and AI-generated code share), Impact (time savings and developer satisfaction), and Cost (total and per-developer AI spend).
Limitations
- Self-reported time savings and developer experience data are subject to response bias. To mitigate this, we triangulate survey responses with system-level telemetry to validate directional trends, rather than relying on any single data source.
- Company-level aggregation means individual team variation within organizations is not captured. Where possible, we segment by organization size, industry, and region to surface meaningful differences and avoid overgeneralizing across dissimilar contexts. In other research insights, we also examine the effect of AI on individual behavior to view user-level trends.
- The sample skews toward organizations that have invested in developer productivity measurement platforms. While this means the findings may not generalize to all engineering organizations, it does ensure a high-quality dataset with consistent measurement practices, making the data especially relevant for organizations evaluating or already using similar platforms.