DX releases Q2 2026 State of AI Impact in Engineering Report
Analysis of 500+ organizations finds AI spend up nearly 28x, while innovation remains flat.
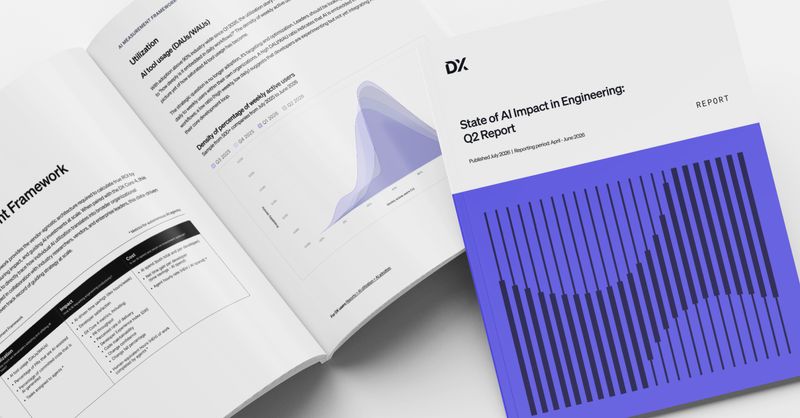
Engineering organizations have entered a critical transition phase, shifting their focus from measuring baseline AI adoption to evaluating concrete return on investment. With AI utilization now above 90% across the industry, the question engineering leaders face is no longer “are we using AI?” but “is it paying off?”
Today, we released our State of AI Impact in Engineering: Q2 Report, a quarterly analysis of 500+ engineering organizations that combines system telemetry with survey data across the DX Core 4 (Speed, Effectiveness, Quality, Impact) and the DX AI Measurement Framework (Utilization, Impact, Cost). The report covers April through June 2026, with trend data extending back to Q3 2025, and shows why rising output and rising cost haven’t yet added up to a clear return.
Key findings from the report
Spend is scaling far faster than the outcomes it’s meant to justify. Median quarterly AI spend grew from roughly $1.5K to $44K in a year, a nearly 28x increase in the Tech sector alone. Over that same period, the innovation ratio (time spent on new feature work versus maintenance) barely moved, holding at roughly 57–58%. Developers are saving real time, now over 6 hours a week for heavy users, but those saved hours are not yet visibly converting into new value at the portfolio level.
Gains are concentrated, and the gap is widening. Small and midsize organizations (15–99 engineers) are pulling away from the rest of the market, hitting ~2.2 PRs/eng/week versus 1.2 for organizations with 750+ engineers. Smaller organizations also pay a premium per seat for AI tools, yet extract more throughput per dollar than larger companies, a direct challenge to the assumption that bigger AI budgets automatically produce better returns.
Code output is increasing, but it’s creating bottlenecks in the other parts the SDLC. Median weekly TrueThroughput rose 37% over four quarters, from 1.42 to 1.94 PRs per engineer per week. But the Developer Experience Index (DXI) fell from 67 to 65 over the same window, dragged down by declines in incremental delivery, local iteration speed, and review turnaround. A single point of DXI decline equates to roughly 10 lost hours per engineer per year, meaning some of the velocity gains are being quietly offset by new friction elsewhere in the system.
Code is easier to read, but harder to trust. Code maintainability improved 3.8% as AI helped developers navigate and understand codebases faster. But change confidence, developers’ trust that their changes won’t break something, fell 6.1% in the same period. Change failure rate volatility also widened, with outlier organizations now swinging as much as +/-3 percentage points against a 4% industry benchmark, suggesting some teams are simply shipping defects faster.
With AI-generated code now accounting for 52.7% of all code, up from just 24% two quarters ago, the report argues that engineering leaders need to shift from measuring adoption to measuring outcomes, pairing every speed and spend metric with a quality and experience counterweight before declaring AI investments a success.
The full report is available now. To see how your data compares, schedule a DX demo.