AI-assisted engineering:
Q1 impact report
The Q1 AI impact report from DX is part of a quarterly series that shares insights and trends from 400+ companies integrating AI into daily engineering work.
Download PDF
Justin Reock
Deputy CTO
A landmark quarter for AI adoption and impact
Since the release of our last AI Impact report in Q4 of 2025, we’ve seen rapid improvement in the AI models available to us, the rise of agentic orchestration, and creative use cases and workflows explored by AI users.
As these trends continue, we’ll continue to take an industry pulse, looking at the same benchmarks and data quarter after quarter to help understand the impacts of AI on the way we develop software.
This year, we expanded our dataset by over 40% more data points to give you a more representative picture. As always, we’ll look at high level trends and dig into deeper analysis, providing clarity with a moment-in-time snapshot of what the current data shows.
Each analysis in this report reflects the subset of developers and companies with available data for that specific metric.
How to interpret these numbers
While industry averages can show broad trends, it’s important to highlight that there is no average experience when it comes to AI impact. AI is an accelerant that is helping some companies accelerate and improve quality, while other companies are speeding up as quality and maintainability degrade.
There are many contextual factors that influence AI impact. At DX, we’re placing more emphasis on longitudinal trends and cohort comparisons, rather than taking an industry average as an overall indication of what to expect across the board. The high adoption of AI tools makes it difficult to compare AI users with non-AI users across the industry, as the sample size for non-users gets smaller and smaller as weeks go by. Instead, many companies are opting to compare regular users (daily and weekly) with light users (monthly) to understand how increased usage impacts productivity.
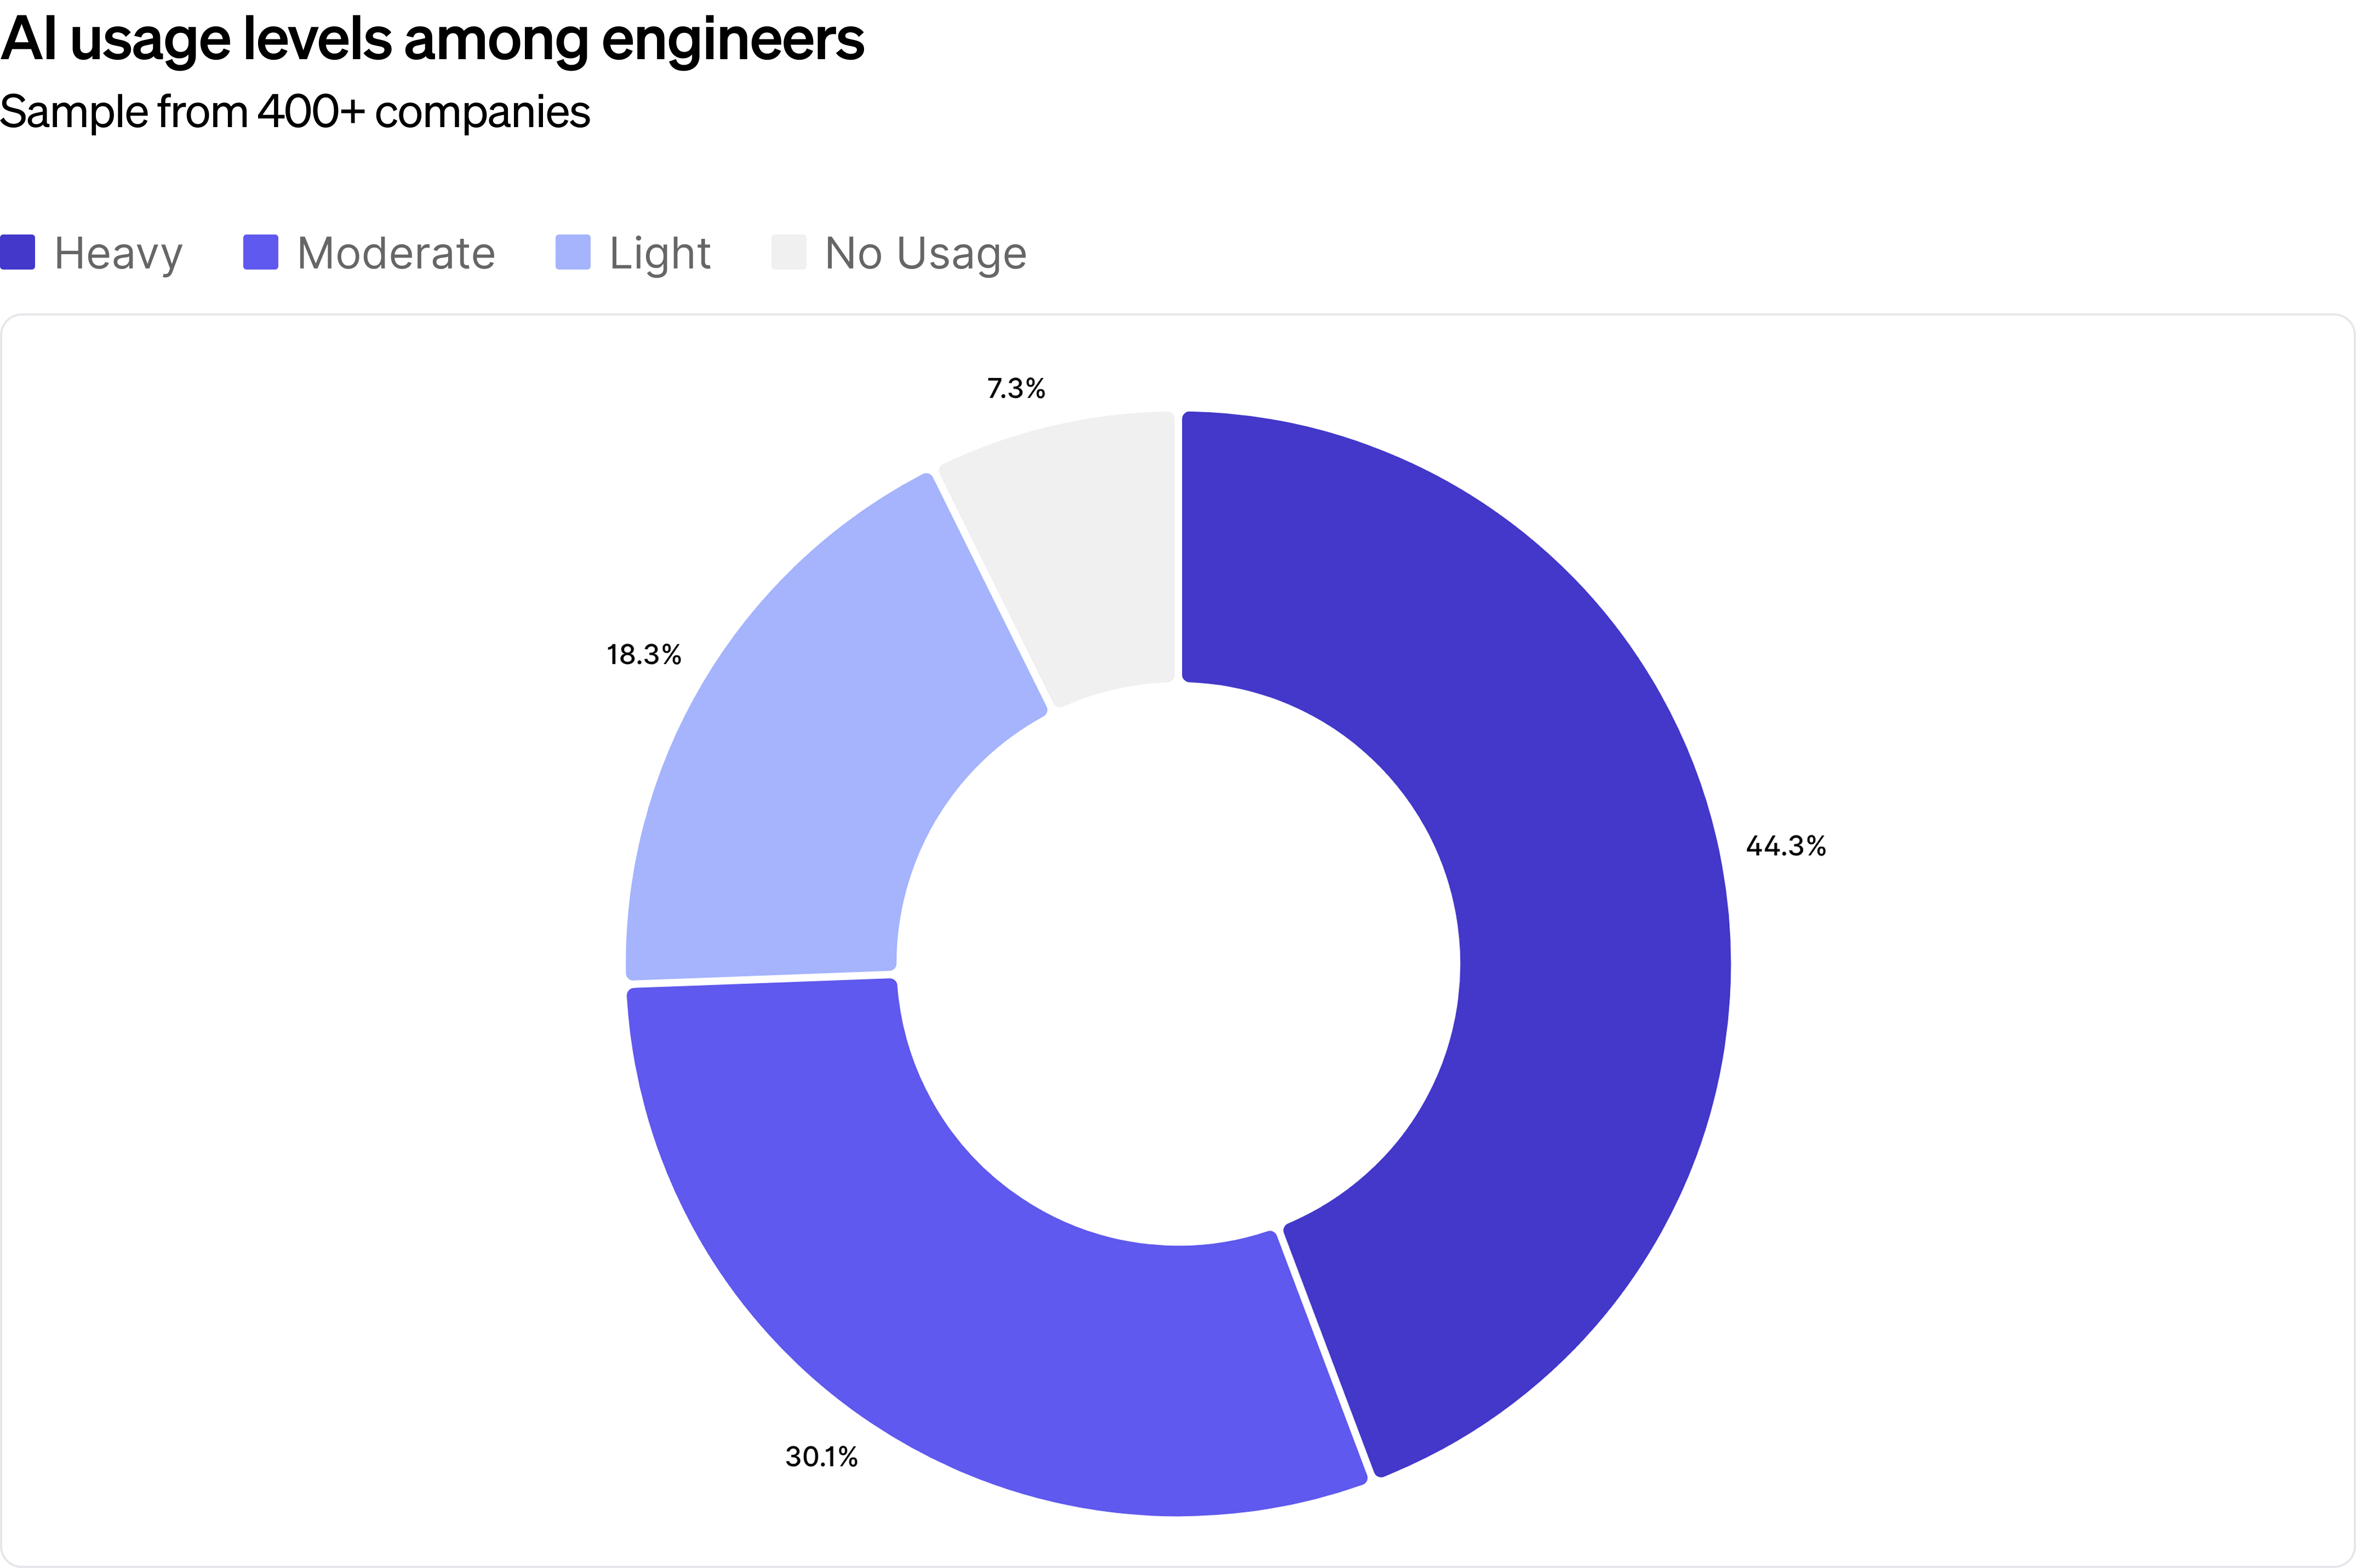
Industry-wide AI adoption increases to 93%
The use of AI has continued to grow since our last report in Q4 2025, where utilization was already at 90%. Other industry analyses independent from DX, such as the DORA report, have also confirmed high adoption rates. AI-assisted engineering has swiftly become a core part of engineering strategy.
But increased adoption means increased cost, and companies need to understand how their AI investments are impacting their engineering performance.
Key findings
- 92.7% of developers are using AI coding tools at least monthly
- Non-Users or No Data: 7.3%
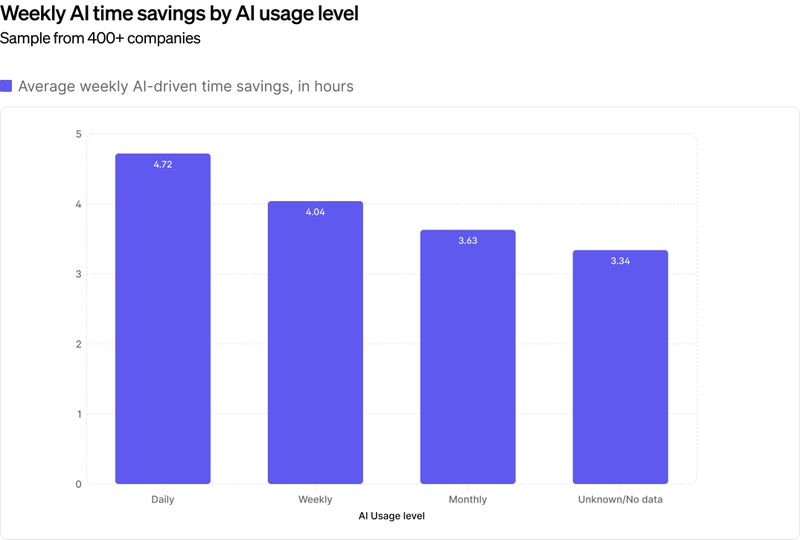
Developers save an average of 3.9 hours per week with AI coding tools
One of the high-level signals we track is self-reported time savings from AI. This gives an early indication of AI usefulness, and is a leading indicator for downstream impact, like faster time to market or more time for innovation. This number is up from our Q4 Report, which found these savings to be 3.6 hours a week.
November and December 2025 were significant months for AI engineering, with the release of the incredible Opus 4.5 model, and the mainstream rise of spec driven development. These advancements are no doubt reflected in the increased time savings demonstrated by the data.
Key findings
- Daily users save the most time: 4.72 hours per week
- Weekly users: 4.04 hours per week
- Monthly users: 3.63 hours per week
- Non/No-Data (shadow AI): 3.34 hours per week
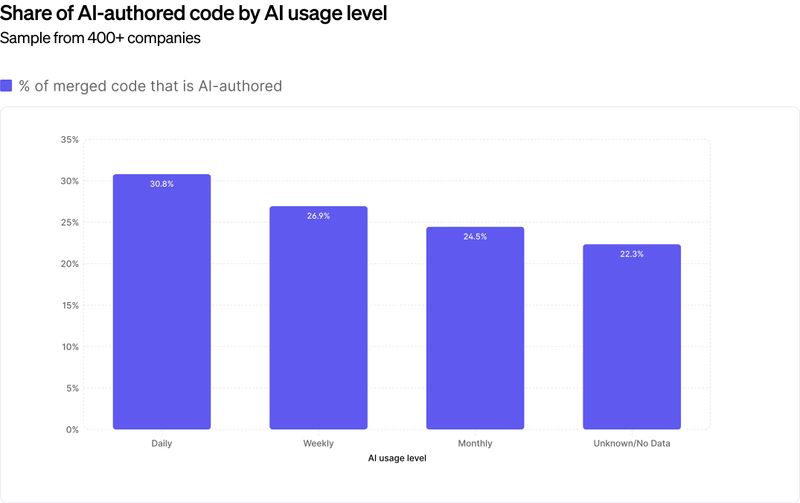
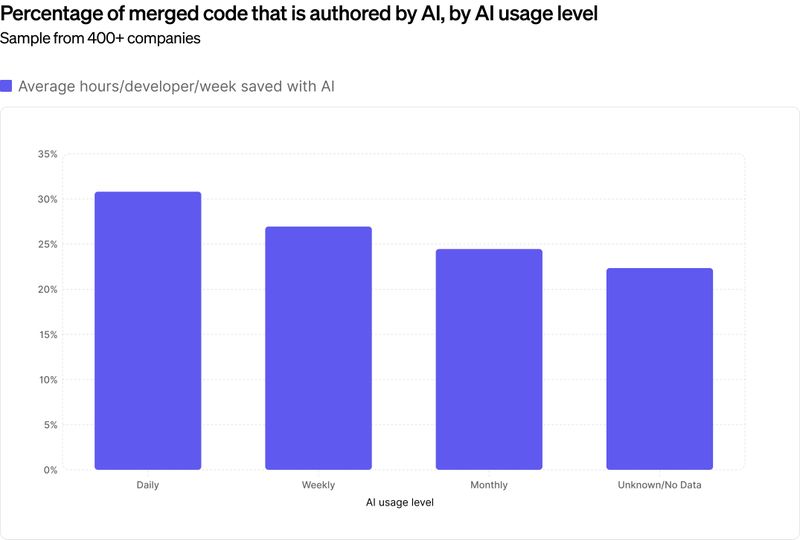
27.4% of code is AI-authored
The percentage of AI-authored code is one of the most talked about metrics in the industry right now and also one of the hardest to measure accurately.
In our definition, AI-authored code is code generated by AI that was merged without major human rewrites or modifications. For this report, we measure the percentage of AI-authored code by asking developers directly how much of their merged code is written by AI. In the future, we will collect this data and compare against a new system-based measure in DX that automatically tracks the percentage of AI-authored code.
Since our last report, the amount of AI-authored code has risen by over an average 5 total percentage points (now close to 30% of code being generated by AI across the board), with daily users seeing an increase of 6.7 percentage points.
Across the board, every user cohort has seen an increase, including users with no telemetry data, signaling that shadow AI is continuing to be prevalent.
- Daily users: 30.8%, up from 24.1%
- Weekly users: 26.94%, up from 21.8%
- Monthly users: 24.45%, up from 20.2%
- Unknown / No telemetry: 22.34%, up from 20.2%
Clearly, and unsurprisingly, heavier users of AI merge more AI-authored code. This represents both a correlation to higher utilization, and a learning curve, as this is code that has been successfully merged and therefore also passed quality checks.
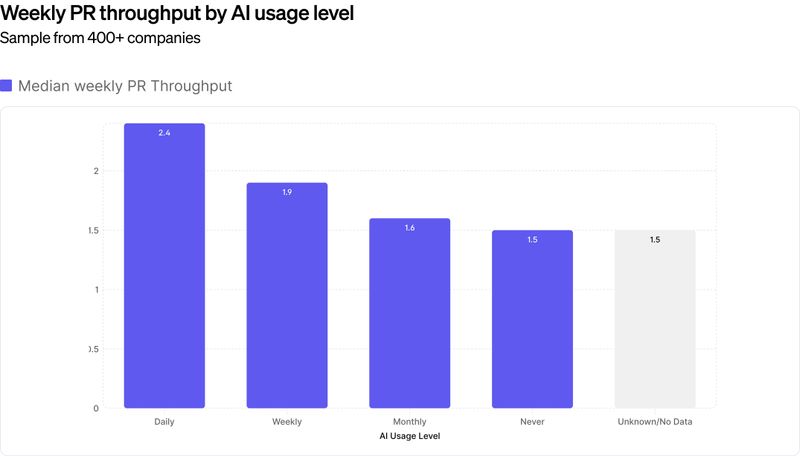
Daily AI users continue to ship the most code
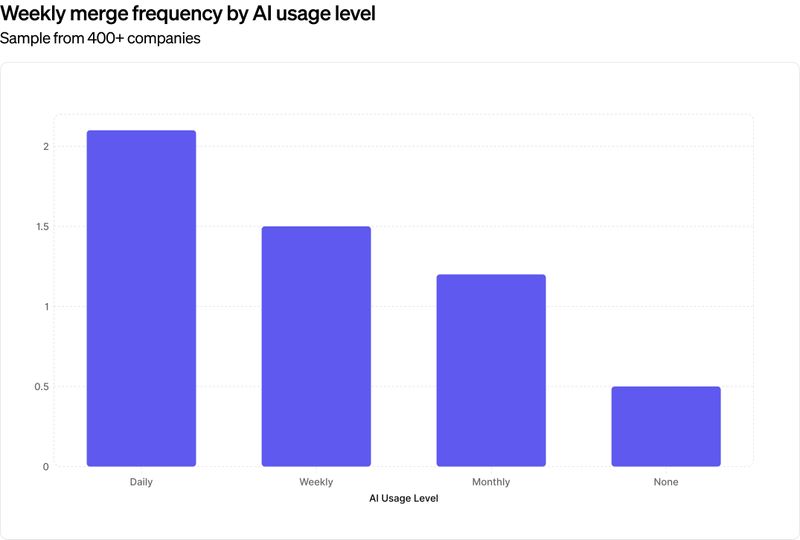
One of the most common questions we hear is whether AI adoption is actually helping developers ship more code. Although not a perfect measure, PR Throughput can give us a directional indication of increased ship frequency.
Over the last quarter, we’ve seen each user cohort increase shipped code. Interestingly, this number is even up for remaining non-users, possibly indicating cascading effects to entire development organizations.
Despite this steady growth, our recent longitudinal study into AI’s impact on PR throughput showed only 10-15% increases over a period of more than a year, from November of 2024 to February of 2026.
There is a correlation between frequency of AI usage and pull request (PR) throughput:
- Daily users of AI merge a median of 2.4 PRs per week (compared to 2.2 in previous report)
- Weekly AI users: 1.9 PRs/week (compared to 1.7 in previous report)
- Monthly AI users: 1.6 PRs/week (compared to 1.5 in previous report)
- Non-users: 1.5 PRs/week (compared to 1.2 in previous report)
This throughput gap between heavy and light AI users has remained steady since the previous quarter.
PR throughput, AI-authored code, and time savings are correlated with AI usage. Daily users of AI save more time coding, merge more AI-authored code, and merge more PRs overall compared to developers who use AI less frequently.
However, it’s still possible that this increase in speed doesn’t lead to better business results. This scenario underscores the need for comprehensive, continuous measurement beyond just coding habits.
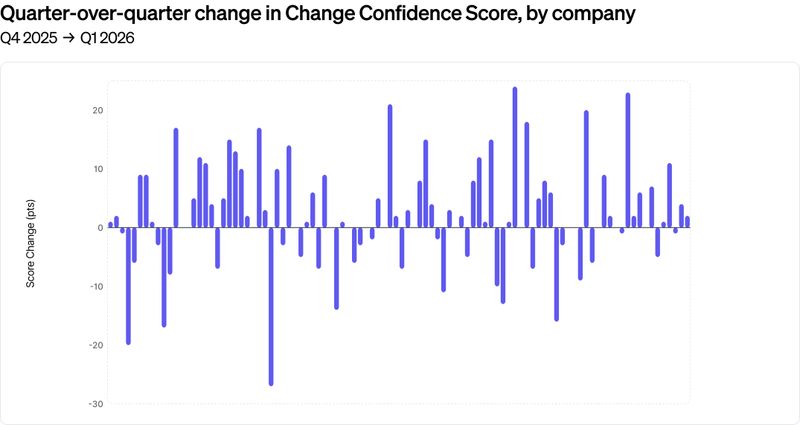
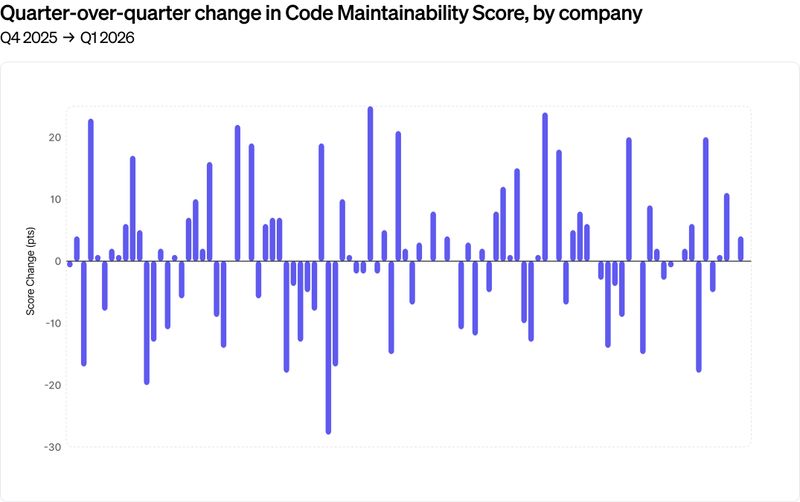
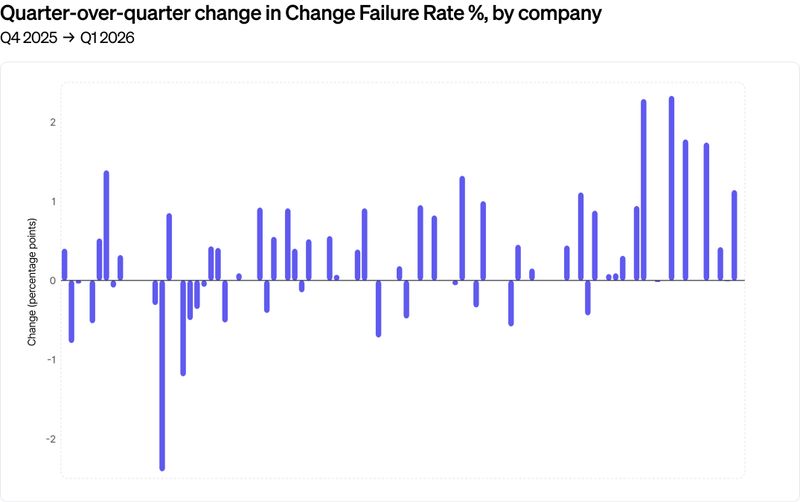
Impact on quality continues to be varied and volatile
To track changes in quality, we looked at the relationship between AI tool usage and measures for quality:
- Change Failure Rate: the percentage of changes that result in degraded performance that must be immediately fixed
- Change Confidence: how confident a developer is that a change will not break in production
- Code Maintainability: how easy it is to understand and modify code
While some organizations are seeing clear improvement to quality as AI usage increases, others are seeing serious degradation, with many swinging significantly.
Change Failure Rate is of particular interest, with some companies increasing this value by almost 2%. Given an industry benchmark of 4%, this indicates that some companies are shipping as many as 50% more defects than before.
There can be multiple reasons for this, stemming from existing code hygiene practices, the availability of formal training on the best use of AI, and the size, complexity, and domain-specificity of the codebase.
For engineering leaders, these findings underscore that successful AI integration requires more than just tool deployment; it demands thoughtful measurement, implementation strategies, and proper training.
Collin Green, a leading UX researcher for Google, offers advice for this concern in DX’s 2025 “Year in Review” podcast.
Teams at Google are starting to set some team norms about how they interact with their code base in the form of standard prompts so that every agent that’s deployed to their code base follows a certain set of prescripted prompts that helps standardize the way that the code is written.
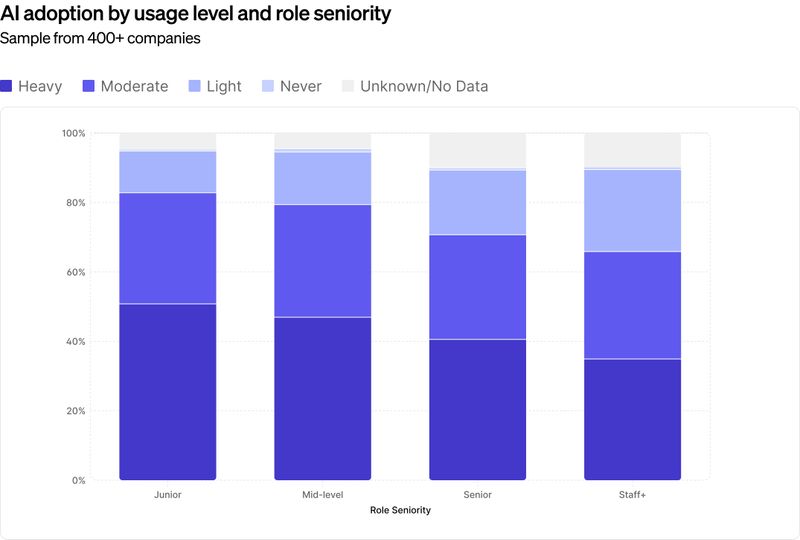
Junior engineers still use AI
the most
Adoption is an important prerequisite for impact, with many companies focusing their AI strategies on rollout and onboarding. These efforts have paid off, with overall adoption reaching 93%+.
Our data continues to suggest that junior developers use AI more frequently than more senior developers. One hypothesis is that junior engineers are more eager to experiment with newer tools. Another is that AI significantly changes developer workflows, and more senior developers have to unlearn parts of their workflow before they can adopt a new paradigm shift, while junior developers have less hindrance here.
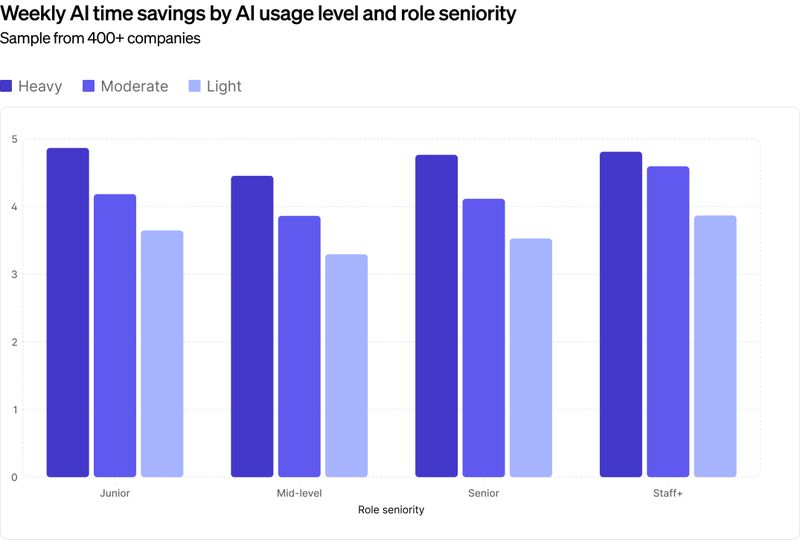
Junior engineers who use AI daily now matching senior engineers in time savings
In our last report, staff+ engineers who used AI daily were saving the most time, despite junior engineers using the technology more frequently. Since that time, junior engineers who use AI daily have overtaken this spot slightly, saving 4.9 hours a week, with staff+ engineers reporting 4.8 hours a week of times savings with daily use.
This trend is limited to daily users, with weekly staff+ users reporting 4.6 hours of savings, to juniors 4.1 hours saved each week.
Since many staff+ engineers spend a lot of time mentoring and reviewing as opposed to writing code, this weekly frequency may simply reflect that staff+ engineers simply write code less frequently, but when they do, they save the most time.
One possibility is that junior engineers, who have consistently used this technology more frequently, are discovering and building into their workflow some of the highest value use cases for AI, leading to more efficient use of the technology.
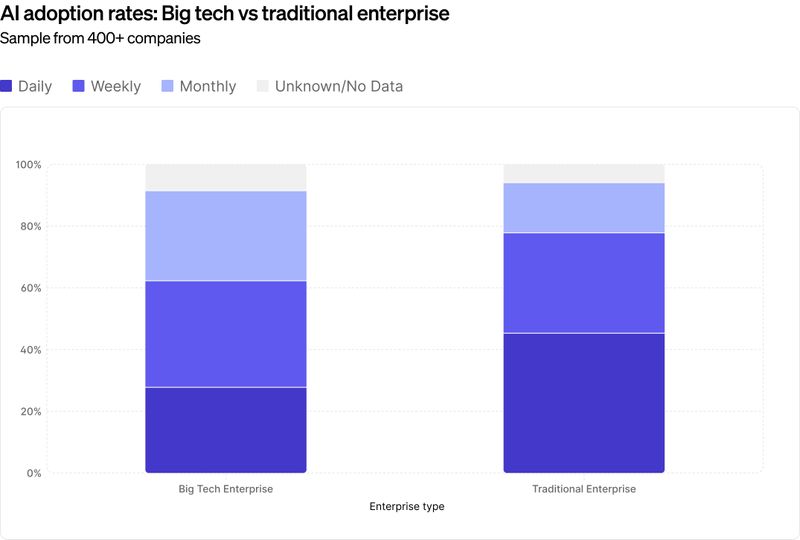
Traditional enterprises continue to see higher adoption rates
While headlines often focus on big tech companies like Google, Meta, and Microsoft, our data reveals an interesting twist: non-tech enterprises, particularly in regulated industries, are currently seeing higher AI adoption rates. This matches the findings in our Q4 report.
These organizations may move more slowly, but their rollouts tend to be deliberate and structured, with a strong emphasis on enablement, training, and governance.
This strategy will not only increase adoption, but it will accelerate the learning curve, lead to the adoption of higher value use cases, and ultimately allow for safer and more efficient use of AI.
Across all companies and industries, we see evidence that structured enablement is a key indicator of AI success. We cannot assume developers will simply ‘get it’ with AI tools. Adoption requires a systematic, measurable approach to rollout and support.
Larger companies are outpacing smaller companies in adoption, but smaller companies are saving more time
Although adoption is up across the board for all company sizes from our Q4 2025 impact report, organizations with 1000-5000 engineers are now seeing the most overall adoption. In addition, AI users at enterprises of this size saved more time per developer than their counterparts in smaller organizations, regardless of AI usage level.
One possible reason for the shift in adoption is that it takes longer for larger companies to complete these rollouts, and when we ran our last analysis, many smaller companies had progressed further in these rollouts, with larger companies keeping up.
Given the increased adoption across the board, these larger companies have now completed more phases of rollout, and as posited in the section earlier on traditional vs. big tech companies, these rollouts are more structured, leading to higher overall adoption in the long run.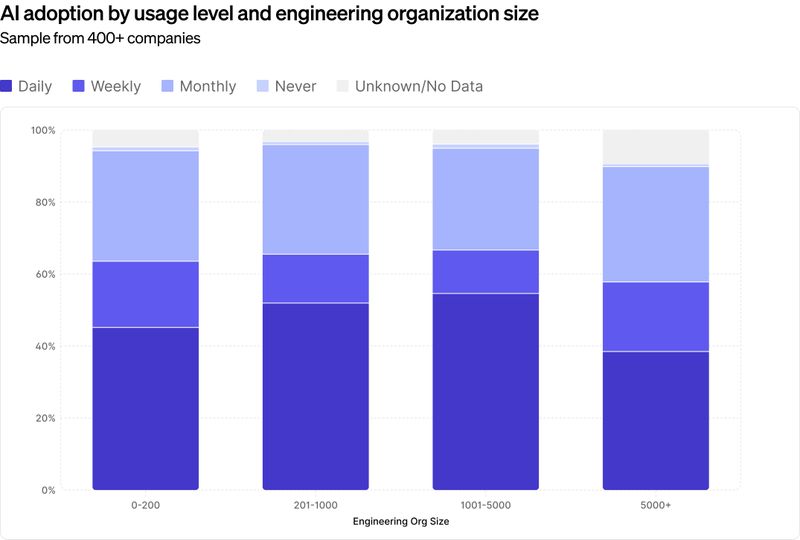
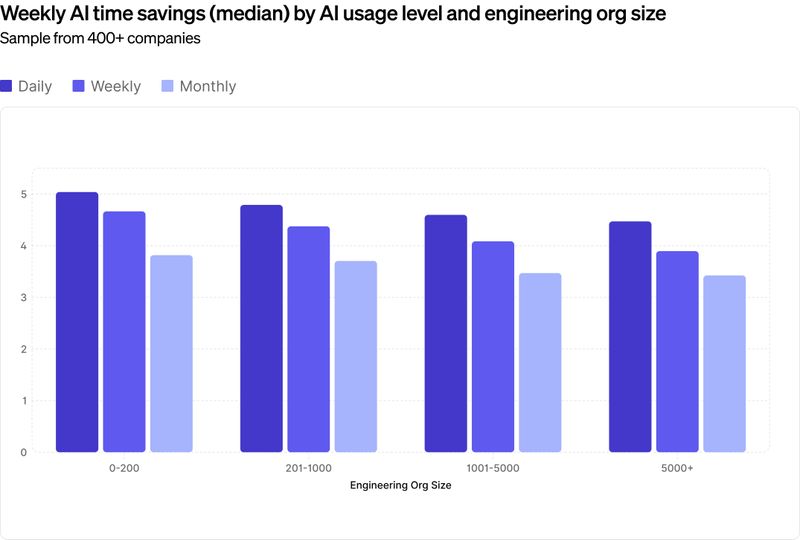
The time savings has shifted as well, with daily AI users at companies with fewer than 200 engineers saving the most time, despite larger companies outpacing in adoption. This may be representative of an aggregate learning curve.
Smaller companies have completed their rollouts earlier, putting them ahead in experience, allowing them to focus on more sophisticated and ultimately higher value use cases for AI.
Smaller companies have completed their rollouts earlier, putting them ahead in experience, allowing them to focus on more sophisticated and ultimately higher value use cases for AI.
“Shadow AI” continues, making acceptable use policies critical
Shadow AI was prevalent in the signals we uncovered in our 2025 Q4 impact report, and we see this trend increasing. Organizations should expect that developers are using personal licenses for AI tools. Users who have no system data from their organization’s enterprise AI tools are still reporting weekly or daily usage, time savings, and a significant percentage of code being created by AI. This confirms that shadow AI is a real phenomenon.
This can happen for several reasons: engineers may have existing habits with a particular tool, prefer a different AI tool their organization has approved, or they’re experimenting with tools outside of code authoring.
Though this behavior is expected, it does pose risks. Without systems guardrails in place, engineers may inadvertently expose sensitive data to models, or accept code changes which aren’t regulated by organizationally accepted system prompts and other rules.
Acceptable use policies are critical to avoid security or license breaches, and clarify what types of data are safe to use with which AI tools. Organizations shouldn’t be too eager to squash experimentation, but rather find the right balance with security and privacy requirements.
Newer AI-native tools continue to outperform others
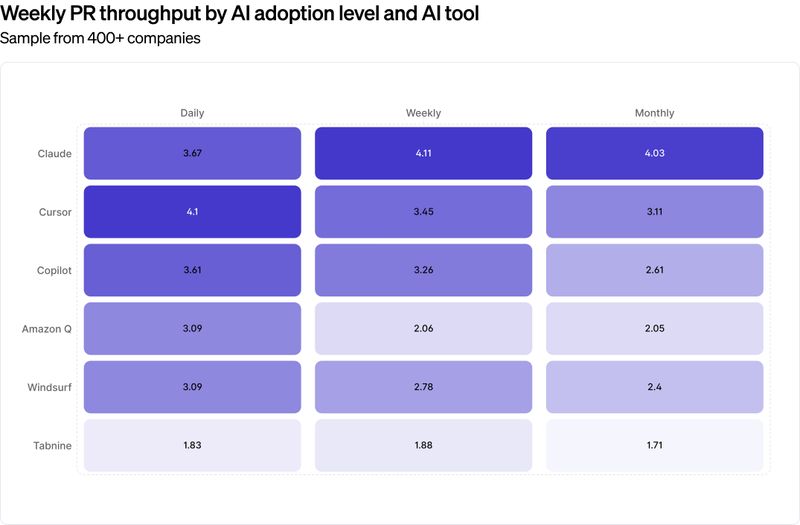
Comparing our latest Q1 2026 data to our Q4 2025 report we observe a performance jump consistently across all tools. This indicates that trends from last quarter’s data are continuing, and that stronger performance is being realized as tool maturity and adoption practice improves.
It’s notable that the throughput rankings themselves have not changed over the last three months, with newer, agentic tools still ranking highest in terms of velocity impact.
Regardless of overall rank, we observed velocity increases across every tool, with a few major shifts since Q4 2025:
- Cursor has seen the largest increase in PR throughput. In Q4 2025, daily users merged a median of 2.8 PRs. Today, that number has jumped to 4.1, representing a 46% increase in throughput for frequent users.
- Claude leads for weekly and monthly users, with PR throughput exceeding 4.0. This is a significant move from the 2.6 (weekly) and 2.2 (monthly) reported just one quarter ago. GitHub Copilot daily users have also accelerated, moving from 2.5 PRs/week in Q4 to 3.61 today.
- Tabnine continues to show the lowest throughput at 1.83 for daily users. As noted in the previous report, this is likely because Tabnine is common in large enterprises where PR throughput is lower overall due to organizational complexity.
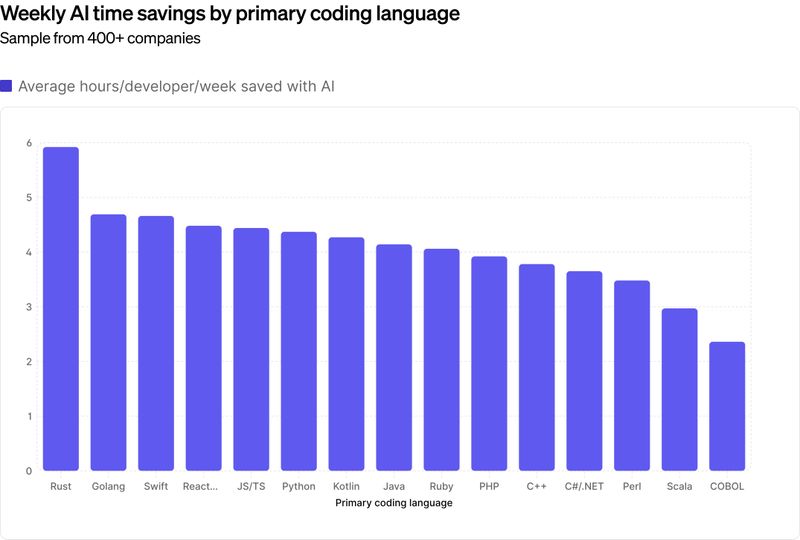
AI delivers bigger gains in modern languages
Not surprisingly, AI delivers bigger gains in modern programming languages. Because today’s models are trained primarily on widely available, publicly accessible code, languages like Python, Java, and Go see the strongest time savings.
One visible trend is Rust suddenly outpacing its competitors significantly. One possible reason for this is the recent rise and improvements in agent self-validation loops, which continuously correct output and refine code before producing final output.
The Rust compiler provides deep, granular details about things like memory safety and other metrics, which can significantly improve the efficacy of these self-validation loops.
Models such as Claude 3.7 and Gemini 2.0/3.0 have undergone documented improvements in late 2025, specifically in “reasoning” around Rust-specific issues. Before these improvements, models would hallucinate lifetimes such as “async.” These models have corrected many of these known issues and crossed a threshold for Rust, leading to much less oversight needed by Rust developers.
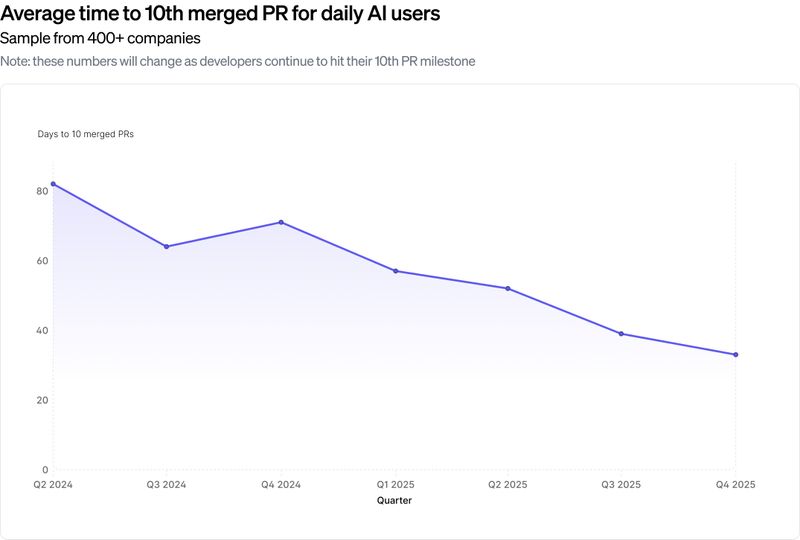
Developer ramp-up continues to accelerate with AI
One of the clearest impacts we’re seeing is on developer onboarding and ramp-up time, specifically in our time to 10th PR metric.
This metric tracks how long it takes new developers to merge their first 10 pull requests. Time to 10th PR has continued the trend of decreasing quarter after quarter at a consistent rate. Though diminishing returns are inevitable as onboarding requires many steps that aren’t currently impacted by AI, this figure decreased another six days from Q3 2025 to Q4 2025, moving from 39 days to 33 days on average.
Though, as more agentic solutions are devised for onboarding processes, we may see this figure continue to decline.
Moreover, this figure has been reduced by more than half since Q1 2024, before the use of AI was widespread in the industry.
The definition of developer continues to expand
In our Q4 2025 report, we found that engineering managers using AI daily shipped twice as many PRs as those who rarely used it or didn’t at all. In just three months, this figure has doubled again, with AI-heavy engineering managers now shipping 4x as much code as those who don’t.
This increase in coding activity continues to reflect the changing shape of the engineering manager role. As some companies opt to flatten out their org structure, engineering managers are getting closer to the code.
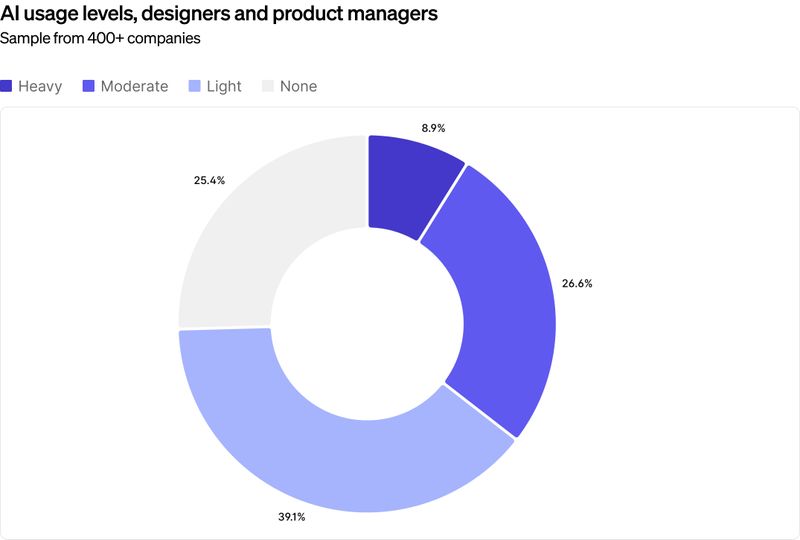
Designers and product managers contributing more code
In our Q4 2025 report, we found that close to 60% of designers and product managers use AI coding tools, such as Claude, Cursor, and Copilot in their routine work. This number has increased to nearly 75%, exhibiting a growing trend as traditional non-builders find more and more use cases for AI tools.
Designers and PMs are increasingly able to prototype and validate ideas much faster, and even deliver their prototypes, PRDs and related material in a vernacular more familiar to developers, decreasing friction in handoff and reducing feedback cycles between designers and engineers.
Fabien Deshayes, a platform engineering leader at Monzo Bank, commented on this shift in a recent episode of the Engineering Enablement podcast.
We’re blurring the line between an engineer and other disciplines. The path from an idea to a prototype to something that can be passed on to an engineer has widely changed in the past few months, and I think it’s going to speed up the way we can develop and ship features.
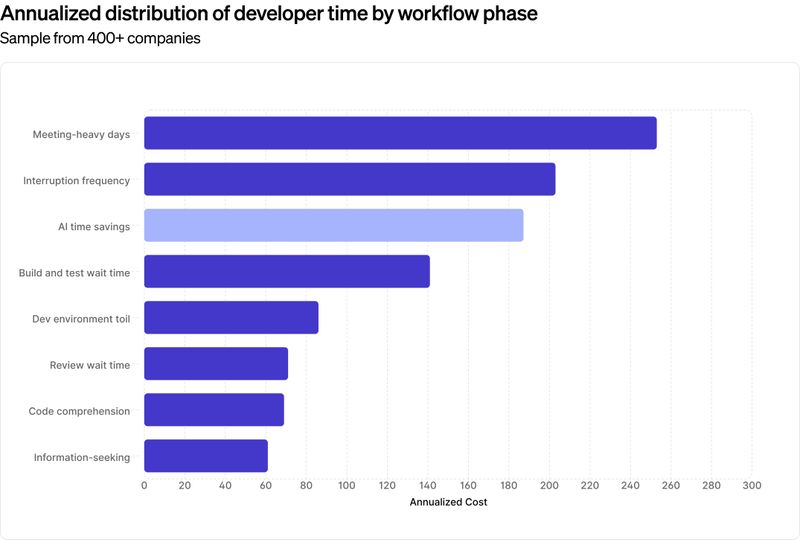
Non-AI factors still outweigh AI benefits
Although it’s clear that AI is saving developers time, when we look at how much time is being lost to other tasks, those savings are eclipsed.
When these time losses are annualized, the expense of these bottlenecks becomes strikingly clear. And when compared to AI time savings, it’s evident that though AI saves time, there are multiple opportunities for efficiency that significantly outweigh those benefits.
Though AI can clearly be a boon to productivity and innovative capacity, it is not a silver bullet, and there are still many areas of opportunities outside of code generation to realize time savings.
It does bear mentioning that many of these bottlenecks can be addressed, at least in part, by strategically integrating AI throughout the SDLC. Organizations should think beyond just code creation with AI to see bigger gains long-term.
Measuring engineering productivity in the AI era
Continuous measurement is a key piece of a successful AI strategy. In this section, we’ll look at how to measure the impact of AI tools inside your own organization.
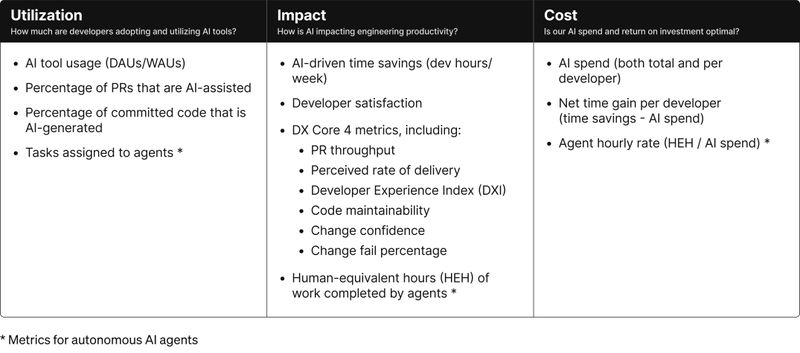
AI Measurement Framework
To address the question of how to measure AI’s impact on productivity, we collaborated with researchers, leading AI vendors, and customers to develop the AI Measurement Framework — a research-based set of metrics for tracking utilization, impact, and ROI of AI-assisted engineering.
The framework is vendor-agnostic and designed to be practical. Any company can begin using these metrics or even a subset of them to establish a clearer, more consistent picture of how AI is influencing developer productivity and ROI.
Core metrics and benchmarks are as important as ever
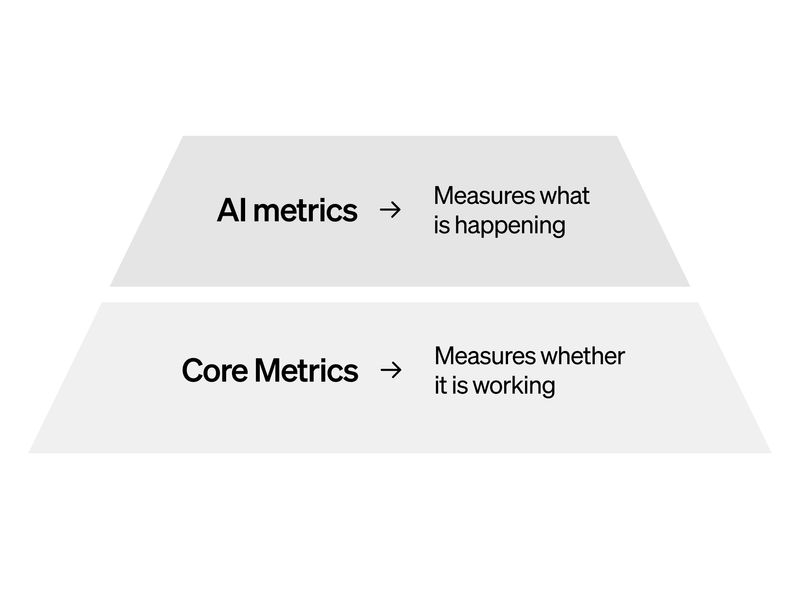
AI introduces new dimensions to track, like adoption and cost, but it doesn’t fundamentally change how we measure developer productivity. The foundations remain the same. Core productivity metrics establish the baseline for evaluating AI’s impact. In other words, AI metrics tell us what’s happening, but core metrics confirm whether it’s actually driving improvement.
Key deviations from Q4 2025 Report
The following findings represent the most significant shifts in the data since the Q4 2025 AI Impact Report:
- For the first time, junior Engineers have overtaken staff+ engineers in daily time savings. In Q4 2025, senior leadership held the lead, but the consistent high-frequency usage by juniors has finally moved them up the learning curve to peak efficiency.
- The data surfaces a reversal in enterprise trends. While large firms (1,000+ devs) saved more time in Q4 2025, smaller companies (<200 devs) are now the efficiency leaders. This suggests that smaller teams have moved past initial rollout friction into sophisticated use cases faster than large enterprises.
- Improvements in “reasoning” models and agentic loops has caused Rust to leapfrog other languages in time savings, thanks to the language’s strict compiler acting as a perfect feedback partner for models like Claude 3.7 and Gemini 3.0.
- Engineering managers have doubled their output again. In Q4, they shipped 2x the code of non-users while today they are shipping 4x as much, solidifying a shift toward player-coach roles.
Key recommendations for 2026
- Shadow AI risk is higher than ever. Companies must move from blocking access to providing better internal alternatives to capture this invisible productivity safely.
- As Change Failure Rates swing by as much as 2% (a 50% increase in defects) for some firms, the focus should shift from speed to validation. Investing in AI-driven automated testing is no longer optional.
- AI is saving nearly 5 hours a week for top users, but CI wait times and meeting bloat still eclipse these gains. AI is a local optimizer. Global optimization requires fixing the human and systemic processes surrounding the code.
Methodologies
This report looks at data from close to 500 companies for the time period of 10/17/2025 to 02/01/2026.
Companies range in size from <50 to over 10,000 employees in both technical and traditional sectors, with headquarters in North America, Latin America, Europe, and Asia-Pacific.
AI usage levels
AI usage tags are derived from system data collected from AI coding assistants like GitHub Copilot, Cursor, and Claude Code. For a full list of DX’s data connectors, refer to our documentation.
- If a user has access to more than one AI code assistant, their usage is aggregated across all tools
- If a user has no evidence of AI tool usage, they are classified as ‘Unknown/No data’, except for users who have self-reported that they do not use AI tools (classified as ‘Never’)
Time savings
Time savings information is collected through self-reported data in a periodic survey using the following closed-option question:
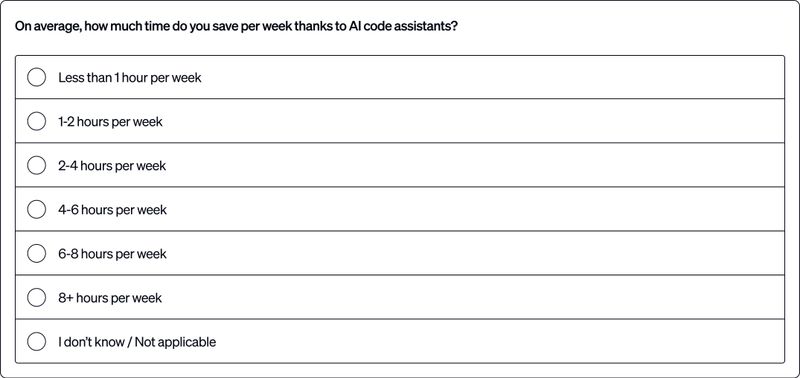
Point-in-time-Snapshot
We do expect this data to change rapidly as organizations undergo significant transformation to adopt AI technologies, and DX will continue to report on these trends quarterly.
Copyright © 2026